3:30 p.m. New York time
Half an hour before the closing bell. The S&P 500 futures continued to rise during the session, reaching into the 6960s.
Elliott Wave Theory: The 4th-wave upward correction that began on November 22 continues and is now in its third and final subwave, wave C.
It’s most recent pullback ended at 6913.25. The price then rose to its present heights. If the price pulls back to below 6913.25, and fail an attempt to climb back, the most likely wave 4 has ended.
9:40 a.m. New York time.
What’s happening now. The S&P 500 futures fell from the 6930s to the 6910s prior to the opening bell, coincident with the delayed release of the 3rd quarter gross domestic product, which showed a 4.3% growth in the economy before the federal government shutdown. At the opening bell, the price then shot back up to the 6930s.
What does it mean? The Elliott Wave Theory description of the chart was changed in yesterday’s afternoon analysis after a 2nd-wave upward correction moved beyond the start of the preceding 1st wave. The theory says that can’t happen, and if it does, then the analysis contains an error and must be redone.
See yesterday’s Trader’s Notebook for details of the reworking.
Going forward, my goal this morning is to understand where the price is likely to go from here. In the new analysis, wave 4{-7}, an upward correction that began on November 21, is still underway and is in its final subwave, rising wave C{-8}, which began on December 17. When wave C{-8} is complete, it will also be the end of wave 4{-7} and beginning of downtrending wave 5{-7}.
The questions: How much higher is wave 4{-7} to rise, and how low is wave 5{-7} to fall?
Based on the lengths of subwaves A{-8} and B{-8}, wave C{-8} may be at its endpoint already, in the 6930s, although it’s quite possible that it will rise into the 6970s. There are other, higher possible targets for the end of wave C{-8}, up into the 6970s or 6990s, or higher, but they are less likely.
The length of the future declining wave 5{-7} depends in part upon how high the prior 4th wave goes. It is almost certain to fall below the wave 4 starting point, 6525, and is likely to end up somewhere in the range of 6420 to 6370.
All forecasts potentially can prove to be wrong as events play out, and they can also prove to be right. This forecast, while rational, is not certain.
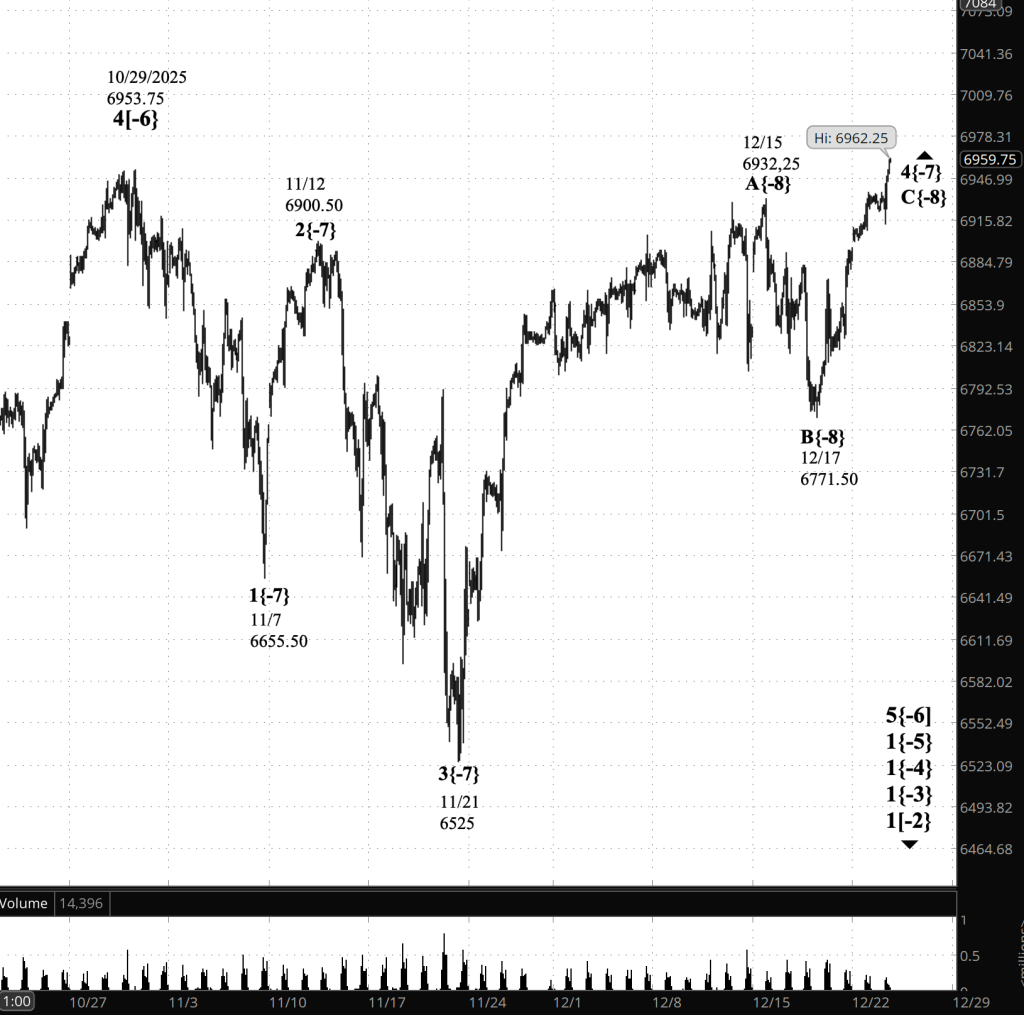
[S&P 500 E-mini futures at 3:30 p.m., 90-minute bars, with volume]
Waves Now Underway
These are the waves currently in progress under my principal analysis. Each line on the list shows the wave number, with the subscript in curly brackets, the traditional degree name, the starting date, the starting price of the S&P 500 E-mini futures, and the direction of the wave.
Most of the waves began not long ago, on October 8, 2025. See my essay posted on October 12, 2025, “The End of the Rise from 1932? Elliott Wave Theory Says ‘Yes’”, for a discussion of how that happened.
The difficult problem of estimating when a wave change should be accept as real rather than a headfake is addressed by the essay titled, “Is This Reversal Real?: How to Tell Without Being Whipsawed”.
- 1{+4} Supermillennium, (unknown start date or start price) {down}
- A hypothetical wave one degree higher than Supercyle, needed to make the wave analysis complete.
- S&P 500 Index:
- 1{+3} Supercycle, 10/8/2025, 6812.25 (down}
- 1{+2} Cycle, 10/8/2025, 6812.25 (down}
- 1{+1} Primary, 10/8/2025, 6812.25 (down}
- 1{0} Intermediate, 10/8/2025, 6812.25 (down}
- 1{-1} Minor, 10/8/2025, 6812.25 (down}
- 1{-2} Minute, 10/8/2025, 6812.25 (down}
- S&P 500 Futures
- 1{-3} Minuette 10/8/2025, 6812.25 (down}
- 1{-4} Subminutte 10/8/2025, 6812.25 (down}
- 1{-5} Micro, 10/8/2025, 6812.25 (down}
- 5{-6} Submicro, 10/29/2025, 6953.75 (down)
- 4{-7} (none), 11/21/2025, 6932.25 (up)
- C{-8} (none), 12/17/2025, 6771.50 (up)
Reading the chart. Price movements — waves – – in Elliott Wave Theory analysis are labeled with numbers within trending waves and letters with corrective waves. The subscripts — numbers in curly brackets — designate the wave’s degree, which, in Elliott Wave analysis, means the relative position of a wave within the larger and smaller structures that make up the chart. R.N. Elliott, who in the 1930s developed the form of analysis that bears his name, viewed the chart as a complex structure of smaller waves nested within larger waves, which in turn are nested within still larger waves. In mathematics it’s called a fractal structure, where at every scale the pattern is similar to the others.
Learning and other resources. Elliott Wave analysis provides context, not prophecy. As the 20th century semanticist Alfred Korzybski put it in his book Science and Sanity (1933), “The map is not the territory … The only usefulness of a map depends on similarity of structure between the empirical world and the map.” And I would add, in the ever-changing markets, we can judge that similarity of structure only after the fact.
See the menu page Analytical Methods for a rundown on where to go for information on Elliott Wave analysis.
By Tim Bovee, Portland, Oregon, December 23, 2025
Disclaimer
Tim Bovee, Private Trader tracks the analysis and trades of a private trader for his own accounts. Nothing in this blog constitutes a recommendation to buy or sell stocks, options or any other financial instrument. The only purpose of this blog is to provide education and entertainment.
No trader is ever 100 percent successful in his or her trades. Trading in the stock and option markets is risky and uncertain. Each trader must make trading decisions for his or her own account, and take responsibility for the consequences.
All content on Tim Bovee, Private Trader by Timothy K. Bovee is licensed under a Creative Commons Attribution-ShareAlike 4.0 International License.
Based on work at www.timbovee.com

You must be logged in to post a comment.