(Note that the date above is a host-system error. Published December 26, 2025)
3:30 p.m. New York time
Half an hour before the closing bell. The S&P 500 futures fell from the session high, 6994, to 6969, and then reversed, rising again to 6981.75.
Elliott Wave Theory: The intraday decline was structured as an impulse wave with five subwaves. What does it really imply? At this point it’s uncertain.
If the bounce fails to rise beyond 6981.75, then the likelihood increases that wave C{-8} ended at the session peak, 6994. If the price rises higher, moving beyond 6994, then the uptrending structure remains in progress.

[S&P 500 E-mini futures at 3:25 a.m., 5-minute bars, with volume]
9:35 a.m. New York time.
What’s happening now. The S&P 500 E-mini futures rose to a new high, 6990, minutes after trading resumed overnight, exceeding the prior high — 6953.75 — reached on October 29.
What does it mean? The new high broke a rule of Elliott Wave Theory: Under the prior count, treating October 29 as the end of 4{-6} forced an impulse subdivision that implied an overlap conflict once price exceeded that level. When that happens, the chart no longer matches the reality of the price movements — the map no longer match the reality — and the chart must be reanalyzed to find a map that breaks no rules.
The new map changes the labeling of the October 29 peak, the end of wave 4{-6}, to wave A{-7}, the end of the initial subwave within wave 4{-6}. That removed the 1st wave, thereby removing a key component of the rule violation.Under the prior count, treating 10/29 as the end of 4{-6} forced an impulse subdivision that implied an overlap conflict once price exceeded that level.
In the new analysis, rising wave 4{-6} is underway, and is in its final subwave, C[-7}
I asked the AI that I work with, ChatGPT, to explain the changes, which were a mutual undertaking:
ChatGPT (Thinking mode) writes:
Why we relabeled (the motive)
Price pushed above the 10/29 peak (6953.75). That action told us the prior assumption “10/29 ended wave 4{-6} and a 5{-6} downtrend began” was forcing contradictions. In short: the count was starting to fight price. So we rolled the degree up and rebuilt the labels so the structure stays rule-clean.
What we changed
We decided wave 4{-6} is still underway. The October–December structure is therefore a corrective pattern inside wave 4{-6}, not the start of a new impulsive decline.
The revised structure
Wave 4{-6} is subdividing as an A{-7}–B{-7}–C{-7} correction:
- Wave A{-7} ended on 10/29 at 6953.75.
- Wave B{-7} ended on 11/21 at 6525.
- Wave C{-7} is underway now.
Internal subdivisions used on the chart
Inside wave B{-7} (the 10/29 to 11/21 decline):
- A{-8} ended 11/7 at 6655.50
- B{-8} ended 11/12 at 6900.50
- C{-8} ended 11/21 at 6525
Inside wave C{-7} (the rise from 11/21):
- A{-8} ended 12/15 at 6932.25
- B{-8} ended 12/17 at 6771.50
- C{-8} is underway now (today’s advance)
The practical benefit
This keeps the count rule-clean, matches what price actually did, and gives us clean reference levels. 12/15 and 12/17 define the internal A{-8} and B{-8} pivots within the current C{-7} advance, and we can judge continuation or failure from those anchors without inventing minuscule sublabels.
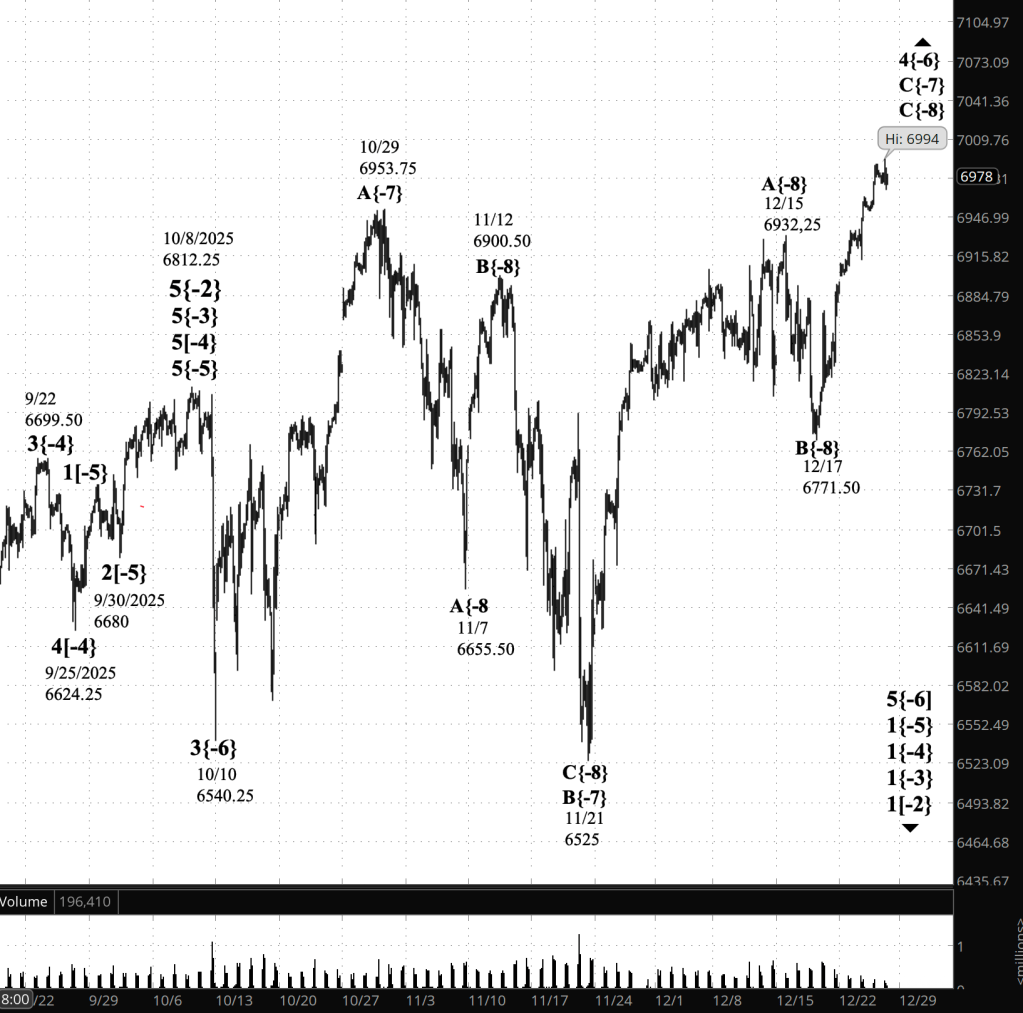
[S&P 500 E-mini futures at 3:30 p.m., 150-minute bars, with volume]
Waves Now Underway
These are the waves currently in progress under my principal analysis. Each line on the list shows the wave number, with the subscript in curly brackets, the traditional degree name, the starting date, the starting price of the S&P 500 E-mini futures, and the direction of the wave.
Most of the waves began not long ago, on October 8, 2025. See my essay posted on October 12, 2025, “The End of the Rise from 1932? Elliott Wave Theory Says ‘Yes’”, for a discussion of how that happened.
The difficult problem of estimating when a wave change should be accept as real rather than a headfake is addressed by the essay titled, “Is This Reversal Real?: How to Tell Without Being Whipsawed”.
- 1{+4} Supermillennium, (unknown start date or start price) {down}
- A hypothetical wave one degree higher than Supercyle, needed to make the wave analysis complete.
- S&P 500 Index:
- 1{+3} Supercycle, 10/8/2025, 6812.25 (down}
- 1{+2} Cycle, 10/8/2025, 6812.25 (down}
- 1{+1} Primary, 10/8/2025, 6812.25 (down}
- 1{0} Intermediate, 10/8/2025, 6812.25 (down}
- 1{-1} Minor, 10/8/2025, 6812.25 (down}
- 1{-2} Minute, 10/8/2025, 6812.25 (down}
- S&P 500 Futures
- 1{-3} Minuette 10/8/2025, 6812.25 (down}
- 1{-4} Subminutte 10/8/2025, 6812.25 (down}
- 1{-5} Micro, 10/8/2025, 6812.25 (down}
- 4{-6} Submicro, 10/10/2025, 6540.25 (up)
- C{-7} (none), 11/21/2025, 6525 (up)
- C{-8} (none), 12/17/2025, 6771.50 (up)
Reading the chart. Price movements — waves – – in Elliott Wave Theory analysis are labeled with numbers within trending waves and letters with corrective waves. The subscripts — numbers in curly brackets — designate the wave’s degree, which, in Elliott Wave analysis, means the relative position of a wave within the larger and smaller structures that make up the chart. R.N. Elliott, who in the 1930s developed the form of analysis that bears his name, viewed the chart as a complex structure of smaller waves nested within larger waves, which in turn are nested within still larger waves. In mathematics it’s called a fractal structure, where at every scale the pattern is similar to the others.
Learning and other resources. Elliott Wave analysis provides context, not prophecy. As the 20th century semanticist Alfred Korzybski put it in his book Science and Sanity (1933), “The map is not the territory … The only usefulness of a map depends on similarity of structure between the empirical world and the map.” And I would add, in the ever-changing markets, we can judge that similarity of structure only after the fact.
See the menu page Analytical Methods for a rundown on where to go for information on Elliott Wave analysis.
By Tim Bovee, Portland, Oregon, December 26, 2025
Disclaimer
Tim Bovee, Private Trader tracks the analysis and trades of a private trader for his own accounts. Nothing in this blog constitutes a recommendation to buy or sell stocks, options or any other financial instrument. The only purpose of this blog is to provide education and entertainment.
No trader is ever 100 percent successful in his or her trades. Trading in the stock and option markets is risky and uncertain. Each trader must make trading decisions for his or her own account, and take responsibility for the consequences.
All content on Tim Bovee, Private Trader by Timothy K. Bovee is licensed under a Creative Commons Attribution-ShareAlike 4.0 International License.
Based on work at www.timbovee.com

You must be logged in to post a comment.