3:30 p.m. New York time
Half an hour before the closing bell. The S&P 500 futures stayed closeted in the same narrow range during the session as it had overnight — the 6950s and the 6940s. As the main economic event of the day occurred — the release of the FOMC Minutes of the early December meeting — the price remained within that narrow range.
Elliott Wave Theory: Still a conundrum. Either rising wave 4{-6} is still underway, or downtrending wave 5{-6} has begun. The FOMC minutes response did nothing to indicate which is the correct description.
Bottom line: The market read the minutes, yawned, and went back to sleep. Same range—just one more excuse attached to it.
9:35 a.m. New York time.
What’s happening now. The S&P 500 E-mini futures traded sideways in a narrow range overnight, remaining with the 6940s and 6950s as the opening bell approachedc.
What does it mean? Elliott Wave Theory remains uncertain whether the rising wave C{-8} remains underway, or if it ended on December 26, also ending the parent wave C{-7} and the upward correction, wave 4{-6}, and beginning downtrending wave 5{-6}.
Adding a note of complexity to the trading day, the minutes of the most recent FOMC meeting will be published at 2 p.m. New York time.
Here are the decision levels, based on an analysis by ChatGPT:
Bull case stays alive if:
- Price reclaims ~6980–6994 and can hold above it (especially if it breaks 6994).
- 6994 is the key “you were wrong about the top” level.
Bear case strengthens if:
- Price breaks down out of this chop and takes out the first meaningful swing low from this pullback (roughly the mid-6940s area on this chart), then
- A follow-through drop below 6932.25 (the 12/15 A{-8} marker) would be a cleaner “trend has turned” confirmation.
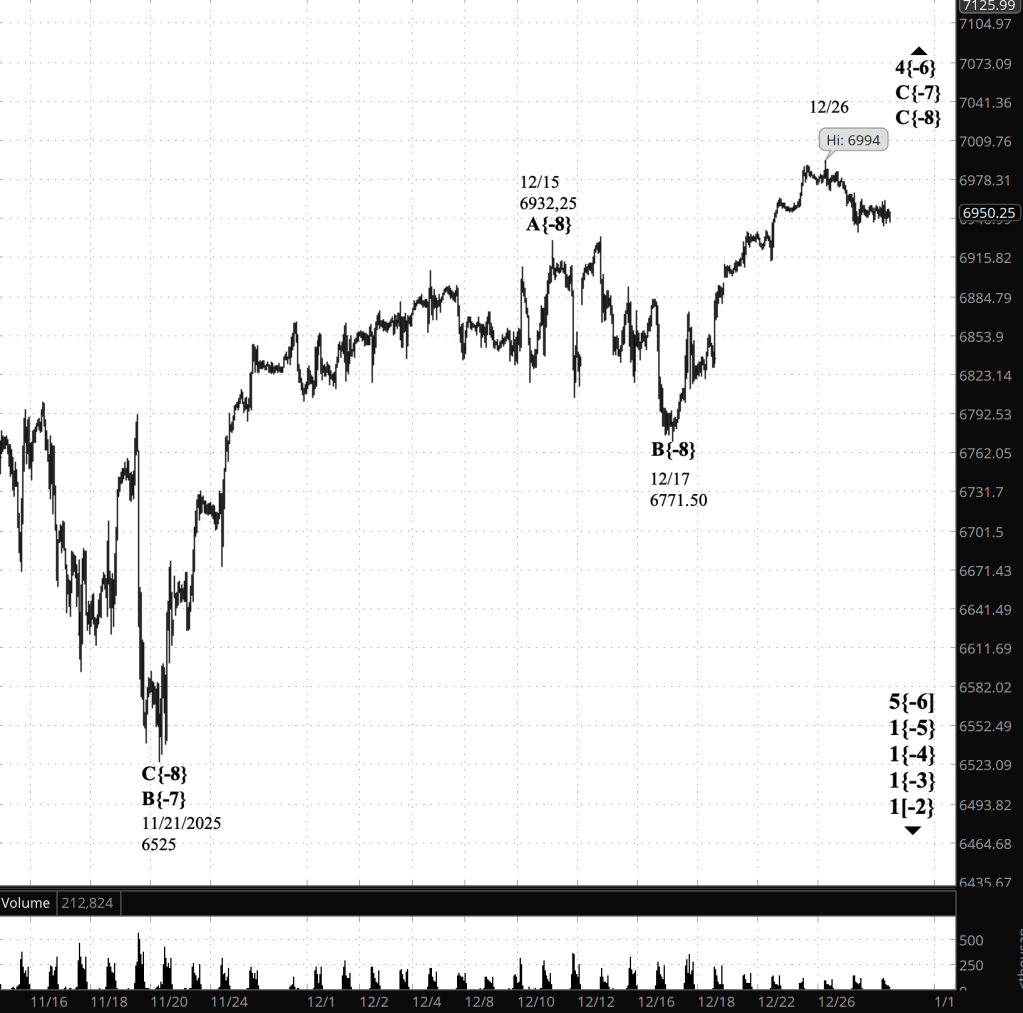
[S&P 500 E-mini futures at 3:30 p.m., 60-minute bars, with volume]
Waves Now Underway
These are the waves currently in progress under my principal analysis. Each line on the list shows the wave number, with the subscript in curly brackets, the traditional degree name, the starting date, the starting price of the S&P 500 E-mini futures, and the direction of the wave.
Most of the waves began not long ago, on October 8, 2025. See my essay posted on October 12, 2025, “The End of the Rise from 1932? Elliott Wave Theory Says ‘Yes’”, for a discussion of how that happened.
The difficult problem of estimating when a wave change should be accept as real rather than a headfake is addressed by the essay titled, “Is This Reversal Real?: How to Tell Without Being Whipsawed”.
- 1{+4} Supermillennium, (unknown start date or start price) {down}
- A hypothetical wave one degree higher than Supercyle, needed to make the wave analysis complete.
- S&P 500 Index:
- 1{+3} Supercycle, 10/8/2025, 6812.25 (down}
- 1{+2} Cycle, 10/8/2025, 6812.25 (down}
- 1{+1} Primary, 10/8/2025, 6812.25 (down}
- 1{0} Intermediate, 10/8/2025, 6812.25 (down}
- 1{-1} Minor, 10/8/2025, 6812.25 (down}
- 1{-2} Minute, 10/8/2025, 6812.25 (down}
- S&P 500 Futures
- 1{-3} Minuette 10/8/2025, 6812.25 (down}
- 1{-4} Subminutte 10/8/2025, 6812.25 (down}
- 1{-5} Micro, 10/8/2025, 6812.25 (down}
- 4{-6} Submicro, 10/10/2025, 6540.25 (up)
- C{-7} (none), 11/21/2025, 6525 (up)
- C{-8} (none), 12/17/2025, 6771.50 (up)
Reading the chart. Price movements — waves – – in Elliott Wave Theory analysis are labeled with numbers within trending waves and letters with corrective waves. The subscripts — numbers in curly brackets — designate the wave’s degree, which, in Elliott Wave analysis, means the relative position of a wave within the larger and smaller structures that make up the chart. R.N. Elliott, who in the 1930s developed the form of analysis that bears his name, viewed the chart as a complex structure of smaller waves nested within larger waves, which in turn are nested within still larger waves. In mathematics it’s called a fractal structure, where at every scale the pattern is similar to the others.
Learning and other resources. Elliott Wave analysis provides context, not prophecy. As the 20th century semanticist Alfred Korzybski put it in his book Science and Sanity (1933), “The map is not the territory … The only usefulness of a map depends on similarity of structure between the empirical world and the map.” And I would add, in the ever-changing markets, we can judge that similarity of structure only after the fact.
See the menu page Analytical Methods for a rundown on where to go for information on Elliott Wave analysis.
By Tim Bovee, Portland, Oregon, December 30, 2025
Disclaimer
Tim Bovee, Private Trader tracks the analysis and trades of a private trader for his own accounts. Nothing in this blog constitutes a recommendation to buy or sell stocks, options or any other financial instrument. The only purpose of this blog is to provide education and entertainment.
No trader is ever 100 percent successful in his or her trades. Trading in the stock and option markets is risky and uncertain. Each trader must make trading decisions for his or her own account, and take responsibility for the consequences.
All content on Tim Bovee, Private Trader by Timothy K. Bovee is licensed under a Creative Commons Attribution-ShareAlike 4.0 International License.
Based on work at www.timbovee.com

You must be logged in to post a comment.