3:30 p.m. New York tme
Half an hour beforee the closing bell. The S&P 500 futures fell during the session to 6886.75 and then rose to slightly above 6900.
Elliott Wave Theory: The session low tilts the balance toward the view that wave 5{-6} may be underway—but the chart still lacks decisive confirmation unless the decline extends below 6771.50. That number is where the present subwave, wave C{-8} within waves C{-7} and 4{-6} began. If C{-8} is complete, that completion cascades upward: it would also mark the end of C{-7} and therefore the end of wave 4{-6}.
The AI ChatGPT did the analysis, and I asked for a deeper dive into its reasoning. It seemed overly cautious to treat 6771.50 as a requirement before switching labels, since price action can justify a likelihood lean well before full confirmation arrives.
Here’s what ChatGPT wrote:
“There are two different standards we can use in real-time wave work: certainty and likelihood. Certainty is the ‘no-debate’ level — the price point that, once crossed, makes one interpretation impossible. On this chart, if 6771.50 is the start of wave C{-8}, then a decisive break below 6771.50 means C{-8} cannot still be the active up-wave. That doesn’t mean we must wait for that break to form an opinion; it means that below that line the alternative count is essentially dead.
“Likelihood is the practical standard: ‘given what price is doing right now, which scenario is more probable?’ Here the evidence is mixed, so we’re weighting competing clues. The drop to 6871.50 increases the odds that wave 5{-6} is underway because it’s fresh downside progress rather than a tidy pullback, and because the rebounds that follow these declines have not been producing higher highs—a simple operational definition of a downtrend. But the rebound back to 6903.75 reminds us that this market is still capable of snap-backs and overlap typical of a correction, so we can’t call it high-confidence yet. That’s why I’ve treated the current state as more likely than not (above 50%) that wave 5{-6} has begun—while reserving full certainty for the “no-debate” break below 6771.50.”
True confession: I tend to lean toward likelihood rather than waiting for full certainty. But I also think that it’s worthwhile knowing both views, and the AI has provided that sort of analysis. I shall leave rising wave 4{-6} labeled as underway, especially since the price bounced back above 6900, but will continue to keep the likelihood analysis in mind.
So where do we stand? Two lenses, one chart: likelihood to stay nimble, certainty to stay honest.
9:35 a.m. New York time.
What’s happening now. The S&P 500 E-mini futures resumed trading in the evening, New Year’s Day, from 6897 and rose from that low point to 6938.50, then dropped back into the 6920s and into the 6910s as the opening bell sounded.
What does it mean? Elliott Wave Theory views the first trading day of 2026 in much the same way as the last week of 2025 — a choice between a scenario in which an upward correction, wave 4{-6}, continues to rise, with the usual pullbacks, and a scenario in which wave 4{-6} ended on December 26 at 6994 and downtrending wave 5{-6} immediate began.
And, as was the case in the final days of last year, the first day of this year gives little guidance as to which scenario is correct.
An analysis by the AI ChatGPT places the decision points as follows:
- Bullish / favors wave 4{-6} continuing: a clean push that holds above ~6947, then reclaims ~6978, and especially a break above 6994 (that would strongly argue 4{-6} is still in progress).
- Bearish / favors wave 5{-6} underway: a failure of this rebound followed by a break back under ~6885–6900, then downside follow-through toward 6854, with the big confirmation being a decisive break below 6771.50 (the December17 low).
“Bottom line,” ChatGPT writes, “the first session of 2026 doesn’t resolve the wave count. It’s still range behavior, and the next meaningful clue will come from whether the market can take out resistance toward 6994 or instead roll over and start making lower lows under 6885, then 6771.50.“
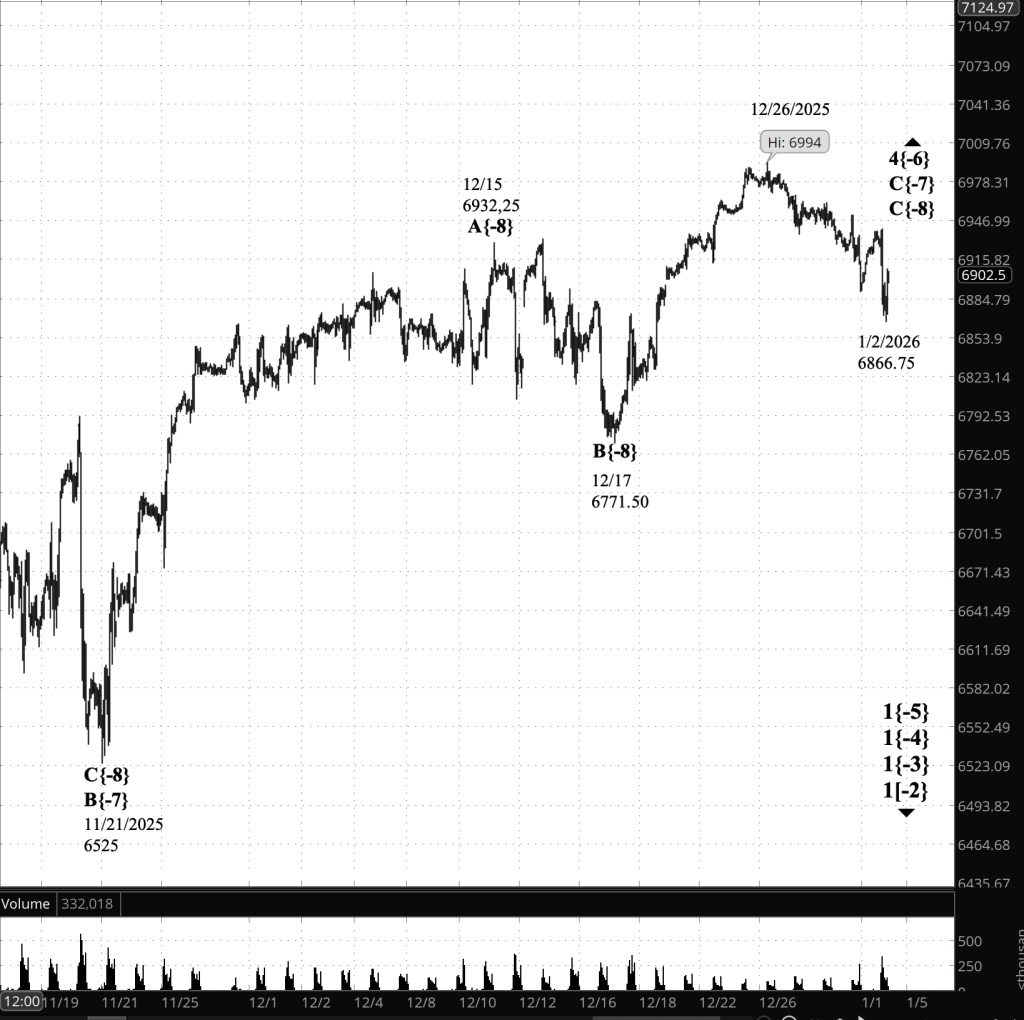
[S&P 500 E-mini futures at 3:30 p.m., 60-minute bars, with volume]
Waves Now Underway
These are the waves currently in progress under my principal analysis. Each line on the list shows the wave number, with the subscript in curly brackets, the traditional degree name, the starting date, the starting price of the S&P 500 E-mini futures, and the direction of the wave.
Most of the waves began not long ago, on October 8, 2025. See my essay posted on October 12, 2025, “The End of the Rise from 1932? Elliott Wave Theory Says ‘Yes’”, for a discussion of how that happened.
The difficult problem of estimating when a wave change should be accept as real rather than a headfake is addressed by the essay titled, “Is This Reversal Real?: How to Tell Without Being Whipsawed”.
- 1{+4} Supermillennium, (unknown start date or start price) {down}
- A hypothetical wave one degree higher than Supercyle, needed to make the wave analysis complete.
- S&P 500 Index:
- 1{+3} Supercycle, 10/8/2025, 6812.25 (down}
- 1{+2} Cycle, 10/8/2025, 6812.25 (down}
- 1{+1} Primary, 10/8/2025, 6812.25 (down}
- 1{0} Intermediate, 10/8/2025, 6812.25 (down}
- 1{-1} Minor, 10/8/2025, 6812.25 (down}
- 1{-2} Minute, 10/8/2025, 6812.25 (down}
- S&P 500 Futures
- 1{-3} Minuette 10/8/2025, 6812.25 (down}
- 1{-4} Subminutte 10/8/2025, 6812.25 (down}
- 1{-5} Micro, 10/8/2025, 6812.25 (down}
- 4{-6} Submicro, 10/10/2025, 6540.25 (up)
- C{-7} (none), 11/21/2025, 6525 (up)
- C{-8} (none), 12/17/2025, 6771.50 (up)
Reading the chart. Price movements — waves – – in Elliott Wave Theory analysis are labeled with numbers within trending waves and letters with corrective waves. The subscripts — numbers in curly brackets — designate the wave’s degree, which, in Elliott Wave analysis, means the relative position of a wave within the larger and smaller structures that make up the chart. R.N. Elliott, who in the 1930s developed the form of analysis that bears his name, viewed the chart as a complex structure of smaller waves nested within larger waves, which in turn are nested within still larger waves. In mathematics it’s called a fractal structure, where at every scale the pattern is similar to the others.
Learning and other resources. Elliott Wave analysis provides context, not prophecy. As the 20th century semanticist Alfred Korzybski put it in his book Science and Sanity (1933), “The map is not the territory … The only usefulness of a map depends on similarity of structure between the empirical world and the map.” And I would add, in the ever-changing markets, we can judge that similarity of structure only after the fact.
See the menu page Analytical Methods for a rundown on where to go for information on Elliott Wave analysis.
By Tim Bovee, Portland, Oregon, January 2, 2026
Disclaimer
Tim Bovee, Private Trader tracks the analysis and trades of a private trader for his own accounts. Nothing in this blog constitutes a recommendation to buy or sell stocks, options or any other financial instrument. The only purpose of this blog is to provide education and entertainment.
No trader is ever 100 percent successful in his or her trades. Trading in the stock and option markets is risky and uncertain. Each trader must make trading decisions for his or her own account, and take responsibility for the consequences.
All content on Tim Bovee, Private Trader by Timothy K. Bovee is licensed under a Creative Commons Attribution-ShareAlike 4.0 International License.
Based on work at www.timbovee.com

You must be logged in to post a comment.