3:30 p.m. New York time
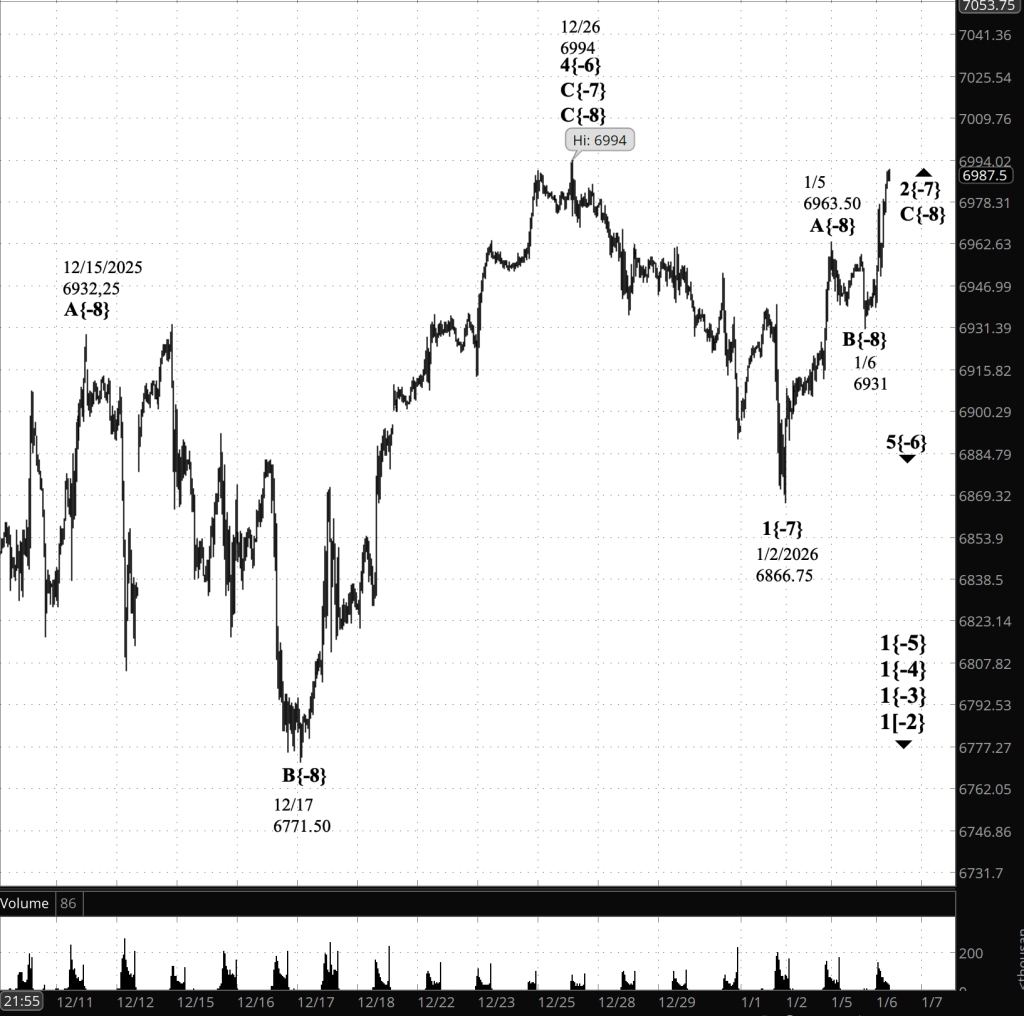
Half an hour before the closing bell. The S&P 500 futures rose rapidly as the session progressed, so far reaching 6990.50, barely below the December 26 peak, 6994.
Elliott Wave Theory. At this point, as long as the price remains below 6994, the analysis sees wave B{-8} as having ended overnight at 6931 and rising wave C{-8} as having begun at that point.
However, if the price rises beyond 6994 and closes above that level, then a rule of Elliott Wave Theory will have been broken. The rule is that no 2nd wave can move beyond the start of the preceding 1st wave. If it doesn’t, the analysis no longer matches the chart — the map no longer matches the terrain — and a renalysis is required.
That renalysis would turn define wave 4{-6} as being underway rather than ending on December 26. Wave 5{-6} would not have begun and would lie in the future.
The decline from December 26 to January 2 would be a subwave within wave C{-7}, a part of wave 4{-6}.
9:35 a.m. New York time.
What’s happening now. The S&P 500 E-mini futures rose to 6958.75 early in the overnight trading and then, at 1:50 a.m. New York time, began to fall, reaching 6931, thereafter rising back into the 6940s.
What does it mean? Elliott Wave Theory analysis suggests that the second subwave, declining subwave B{-8}, is now underway, within an upward correction, wave 2{-7}, which is a subwave within declining subwave 5{-6}.
As always, there is ambiguity. I think wave B{-8} has begun, but it’s also possible that its predecessor, rising wave A{-8}, is still underway.
I’ve labeled the chart to show wave B{-8} is underway, my principal analysis. This is likely correct, in my opinion. However, we don’t “verify” B{-8} just because price dips. We verify it when the decline has staying power.
Here are the signal prices identified by the AI ChatGPT.
The key level is ~6926 (the 38% retrace of A{-8}).
Verification requirement: break below ~6926 and hold there long enough to prove it’s not a one-bar poke.
Next confirmation step: follow-through toward ~6915 (the 50% retrace). If price gets there, B{-8} is no longer a guess.
The alternative analysis — wave A{-8} continues — is still alive if the overnight drop proves to be noise and the market reasserts the uptrend.
The key level is 6963.50 (yesterday’s A{-8} high).
Verification requirement: reclaim 6963.50 and hold above it.
If price can hold above 6963.50, then the “B{-8} underway” call is not verified, and the market is telling us the up-leg is still in progress.
[S&P 500 E-mini futures at 9:35 a.m., 60-minute bars, with volume]
Waves Now Underway
These are the waves currently in progress under my principal analysis. Each line on the list shows the wave number, with the subscript in curly brackets, the traditional degree name, the starting date, the starting price of the S&P 500 E-mini futures, and the direction of the wave.
Most of the waves began not long ago, on October 8, 2025. See my essay posted on October 12, 2025, “The End of the Rise from 1932? Elliott Wave Theory Says ‘Yes’”, for a discussion of how that happened.
The difficult problem of estimating when a wave change should be accept as real rather than a headfake is addressed by the essay titled, “Is This Reversal Real?: How to Tell Without Being Whipsawed”.
- 1{+4} Supermillennium, (unknown start date or start price) {down}
- A hypothetical wave one degree higher than Supercyle, needed to make the wave analysis complete.
- S&P 500 Index:
- 1{+3} Supercycle, 10/8/2025, 6812.25 (down}
- 1{+2} Cycle, 10/8/2025, 6812.25 (down}
- 1{+1} Primary, 10/8/2025, 6812.25 (down}
- 1{0} Intermediate, 10/8/2025, 6812.25 (down}
- 1{-1} Minor, 10/8/2025, 6812.25 (down}
- 1{-2} Minute, 10/8/2025, 6812.25 (down}
- S&P 500 Futures
- 1{-3} Minuette 10/8/2025, 6812.25 (down}
- 1{-4} Subminutte 10/8/2025, 6812.25 (down}
- 1{-5} Micro, 10/8/2025, 6812.25 (down}
- 4{-6} Submicro, 10/10/2025, 6540.25 (up)
- 5[-6} Minuscule,12//26/2025, 6994 (down)
- 2{-7} (none), 1/2/2026, 6866.75 (up)
- C{-8} (none), 1/6/2026, 6931 (up)
Reading the chart. Price movements — waves – – in Elliott Wave Theory analysis are labeled with numbers within trending waves and letters with corrective waves. The subscripts — numbers in curly brackets — designate the wave’s degree, which, in Elliott Wave analysis, means the relative position of a wave within the larger and smaller structures that make up the chart. R.N. Elliott, who in the 1930s developed the form of analysis that bears his name, viewed the chart as a complex structure of smaller waves nested within larger waves, which in turn are nested within still larger waves. In mathematics it’s called a fractal structure, where at every scale the pattern is similar to the others.
Learning and other resources. Elliott Wave analysis provides context, not prophecy. As the 20th century semanticist Alfred Korzybski put it in his book Science and Sanity (1933), “The map is not the territory … The only usefulness of a map depends on similarity of structure between the empirical world and the map.” And I would add, in the ever-changing markets, we can judge that similarity of structure only after the fact.
See the menu page Analytical Methods for a rundown on where to go for information on Elliott Wave analysis.
By Tim Bovee, Portland, Oregon, January 6, 2026
Disclaimer
Tim Bovee, Private Trader tracks the analysis and trades of a private trader for his own accounts. Nothing in this blog constitutes a recommendation to buy or sell stocks, options or any other financial instrument. The only purpose of this blog is to provide education and entertainment.
No trader is ever 100 percent successful in his or her trades. Trading in the stock and option markets is risky and uncertain. Each trader must make trading decisions for his or her own account, and take responsibility for the consequences.
All content on Tim Bovee, Private Trader by Timothy K. Bovee is licensed under a Creative Commons Attribution-ShareAlike 4.0 International License.
Based on work at www.timbovee.com

You must be logged in to post a comment.