3:30 p.m. New York time
Half an hour before the closing bell. The S&P 500 futures traded in a mixed session, with a low in the 6970s and a late push to a new high of 7006.75. The move did not hold. As of now, price has pulled back to 6985.75.
Elliott Wave Theory. This morning’s revision remains in place. Rising wave 3{-8}, which began on January 2, continues to advance. It is the middle subwave of rising wave C{-7}, the final subwave of wave 4{-6}, an upward correction that began on October 10, 2025.
What to watch next. Today’s spike to 7006.75 looks like a test rather than a breakout. If price can return above 7006.75 and hold, the correction remains in force and may extend. If instead the rejection stands and price breaks down through 6975.25, the odds rise that the advance is stalling. The more meaningful downside break remains 6931. A break below 6866.75 would be the cleanest confirmation that the correction ended and a larger decline is underway.
10:45 a.m. New York time
A New Chart. The S&P 500 futures rose suddenly 15 minutes into the session, moving above the prior high, 6994 on December 26, to 6998.75. The price swiftly withdrew back to 6991.25. The move had no staying power, but the break itself is the key fact.
The specific Elliott Wave count I published this morning treated 6994 as the ceiling for wave 2{-7}. Since price exceeded that level, that version of the count is invalidated as written and must be adjusted. This does not automatically turn the market bullish. It simply means the upward corrective structure remains in force for now.
What to watch next. 6998.25 is now the immediate ceiling. If price returns above it and holds, the correction is still strengthening. If instead today’s spike proves to be a rejection and price rolls over, the first downside tell is 6975.25, and the more important confirmation remains a decisive break back below 6931.
As always, when the Elliott Wave analysis no longer matches the reality on the chart — when the map no longer matches the terrain — the chart must be redone in order to fix the mismatch.
The new map:
- Rising wave 4{-6}, which began on October 10, 2025, continues.
- It is presently in its final subwave, rising wave C{-7}.
- The C wave is in the 3rd of five subwaves, wave 3{-8}, which began on January 2.
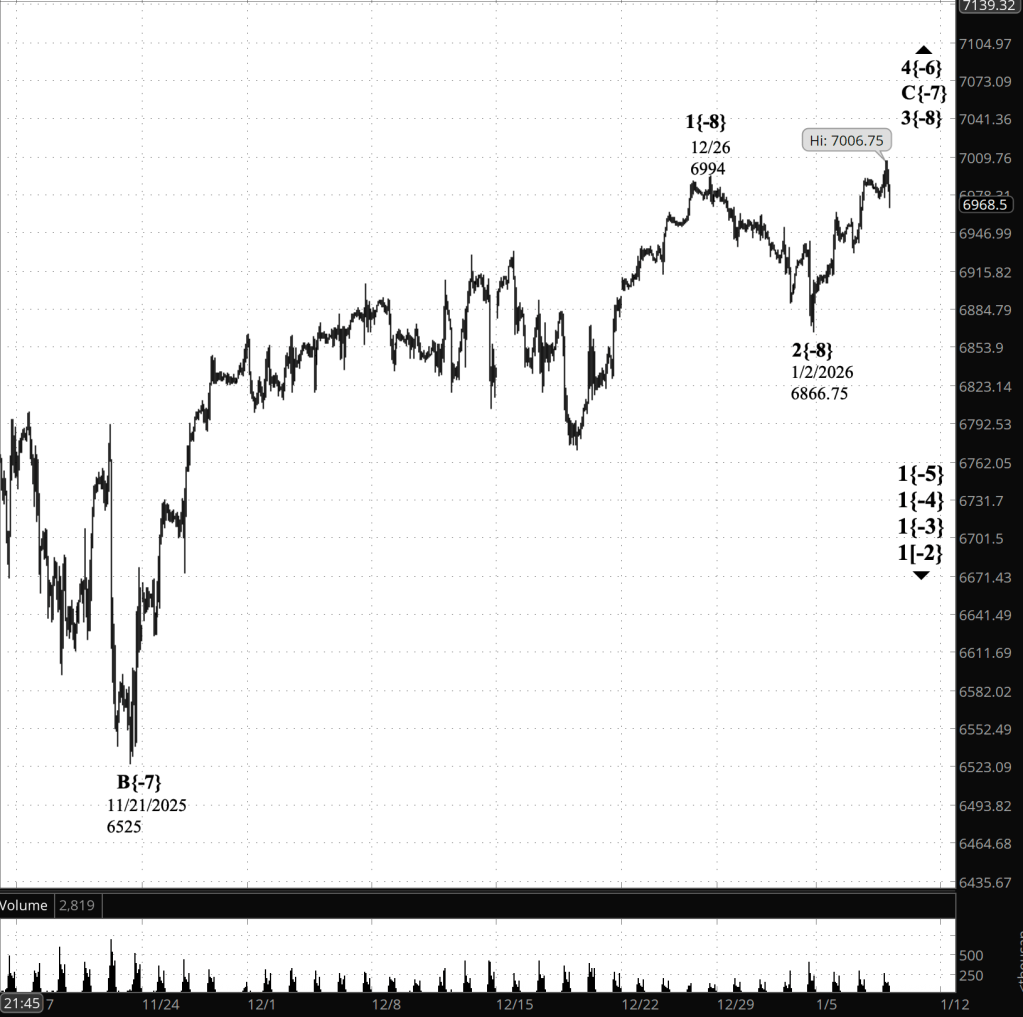
[S&P 500 E-mini futures at 3:30 p.m., 75-minute bars, with volume]
9:35 a.m. New York time.
What’s happening now. The S&P 500 E-mini futures fell overnight from 6991.50 to 6975.25 and then returned to 6990 and the 6980s. The price rose slightly with the openng bell, back to 6991.50, then pulled back.
What does it mean? Elliott Wave Theory analysis sees wave C{-8}, the final subwave of a 2nd-wave upward correction, wave 2{-7}, as being underway.
The larger structure still reads as: The December 26 peak at 6994 ended wave 4{-6}, and the decline into 1/2 at 6866.75 was wave 1{-7} of the new downtrend, 5{-6}. Since then we’ve been in the corrective rebound, wave 2{-7}, which is now in its final leg, wave C{-8} (with A{-8} = 6963.50 on 1/5 and B{-8} = 6931 on 1/6 already in place).
What to watch now.
- Ceiling / invalidation: A 2nd wave cannot exceed the start of the 1st wave. So a push above 6994 invalidates this count and forces a relabel.
- The tell for completion: If this C{-8} rally stalls in the 6985–6994 zone and then breaks back down through 6931, that’s the cleanest confirmation that 2{-7} is over and the next impulsive decline is underway.
- Near-term pivot: Overnight’s dip to 6975.25 held and snapped back. That’s typical “last push” behavior in a C-wave—bulls can still squeeze it higher, but the risk is that the next failure is sharp.
Trading posture (quick). Treat the current strength as corrective until proven otherwise. I’m watching for either (1) rejection under 6994, or (2) a clean break back below 6931 to signal that the downtrend has regained control.
[This chart is now updated and retained for reference. See above for the updated chart.]
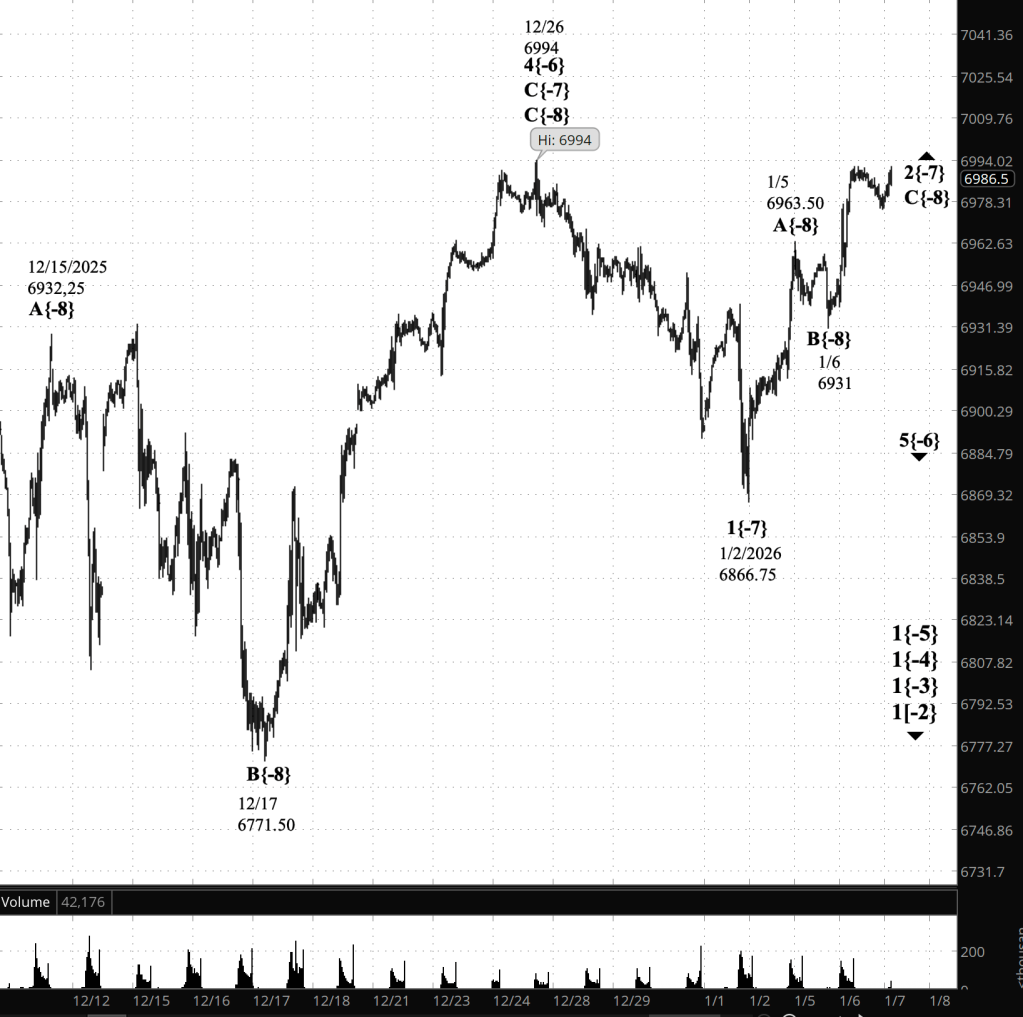
[S&P 500 E-mini futures at 9:35 a.m., 35-minute bars, with volume]
Waves Now Underway
These are the waves currently in progress under my principal analysis. Each line on the list shows the wave number, with the subscript in curly brackets, the traditional degree name, the starting date, the starting price of the S&P 500 E-mini futures, and the direction of the wave.
Most of the waves began not long ago, on October 8, 2025. See my essay posted on October 12, 2025, “The End of the Rise from 1932? Elliott Wave Theory Says ‘Yes’”, for a discussion of how that happened.
The difficult problem of estimating when a wave change should be accept as real rather than a headfake is addressed by the essay titled, “Is This Reversal Real?: How to Tell Without Being Whipsawed”.
- 1{+4} Supermillennium, (unknown start date or start price) {down}
- A hypothetical wave one degree higher than Supercyle, needed to make the wave analysis complete.
- S&P 500 Index:
- 1{+3} Supercycle, 10/8/2025, 6812.25 (down}
- 1{+2} Cycle, 10/8/2025, 6812.25 (down}
- 1{+1} Primary, 10/8/2025, 6812.25 (down}
- 1{0} Intermediate, 10/8/2025, 6812.25 (down}
- 1{-1} Minor, 10/8/2025, 6812.25 (down}
- 1{-2} Minute, 10/8/2025, 6812.25 (down}
- S&P 500 Futures
- 1{-3} Minuette 10/8/2025, 6812.25 (down}
- 1{-4} Subminutte 10/8/2025, 6812.25 (down}
- 1{-5} Micro, 10/8/2025, 6812.25 (down}
- 4{-6} Submicro, 10/10/2025, 6540.25 (up)
- C{-7} Minuscule, 11/21/2025, 6525 (up)
- 3{-8} (none), 1/2/2026, 6866.75 (up)
Reading the chart. Price movements — waves – – in Elliott Wave Theory analysis are labeled with numbers within trending waves and letters with corrective waves. The subscripts — numbers in curly brackets — designate the wave’s degree, which, in Elliott Wave analysis, means the relative position of a wave within the larger and smaller structures that make up the chart. R.N. Elliott, who in the 1930s developed the form of analysis that bears his name, viewed the chart as a complex structure of smaller waves nested within larger waves, which in turn are nested within still larger waves. In mathematics it’s called a fractal structure, where at every scale the pattern is similar to the others.
Learning and other resources. Elliott Wave analysis provides context, not prophecy. As the 20th century semanticist Alfred Korzybski put it in his book Science and Sanity (1933), “The map is not the territory … The only usefulness of a map depends on similarity of structure between the empirical world and the map.” And I would add, in the ever-changing markets, we can judge that similarity of structure only after the fact.
See the menu page Analytical Methods for a rundown on where to go for information on Elliott Wave analysis.
By Tim Bovee, Portland, Oregon, January 7, 2026
Disclaimer
Tim Bovee, Private Trader tracks the analysis and trades of a private trader for his own accounts. Nothing in this blog constitutes a recommendation to buy or sell stocks, options or any other financial instrument. The only purpose of this blog is to provide education and entertainment.
No trader is ever 100 percent successful in his or her trades. Trading in the stock and option markets is risky and uncertain. Each trader must make trading decisions for his or her own account, and take responsibility for the consequences.
All content on Tim Bovee, Private Trader by Timothy K. Bovee is licensed under a Creative Commons Attribution-ShareAlike 4.0 International License.
Based on work at www.timbovee.com

You must be logged in to post a comment.