3:30 p.m. New York time
Half an hour before the closing bell. The S&P 500 E-mini futures continued to rise during the session, breaking above Wednesday’s peak and reaching a higher high of 7017.50 so far.
Elliott Wave Theory. The January 7 small downward correction has clearly ended. Rising wave 3{-8} continues, within rising wave C{-7}, within the upward correction, wave 4{-6}.
9:35 a.m. New York time.
What’s happening now. The S&P 500 E-mini futures in early trading overnight dropped to 6954.75, rising swiftly into the 6980s with the release of the Employment Situation Report an hour before the opening bell. It is the first normal report since the end of the federal government spending shutdown in September and October 2025. The price then swiftly fell back into the 6960s as the opening bell sounded.
What does it mean? Notably, in terms of Elliott Wave Theory, the futures’ positive response to the jobs report fell short of the peak of wave 3{-8} so far, 7006.75 reached on January 7. The price might well reach that high point again, or perhaps exceed it. But that hasn’t happened yet, and the market response was a happy pop but not an overwhelming one.
The AI, ChatGPT, identifies the following levels as decision points:
- Line in the sand for “just a news pop”: ~6966, then 6954.25. A drop back through those levels starts to look like a full post-news fade.
- Immediate resistance / “did the spike hold?”: ~6988.5 (the post-report high). A clean push through and hold suggests continuation.
- Near-term support (breakout area): ~6974–6976 (the last shelf before the vertical move). If price retests and holds, the spike looks real.
Wave 3{-8}, which began on January 2, is a subwave of wave C{-7}, which began on November 21, 2025 and is a subwave of an upward correction, wave 4{-6}, which began on October 10, 2025, from 6540.25.
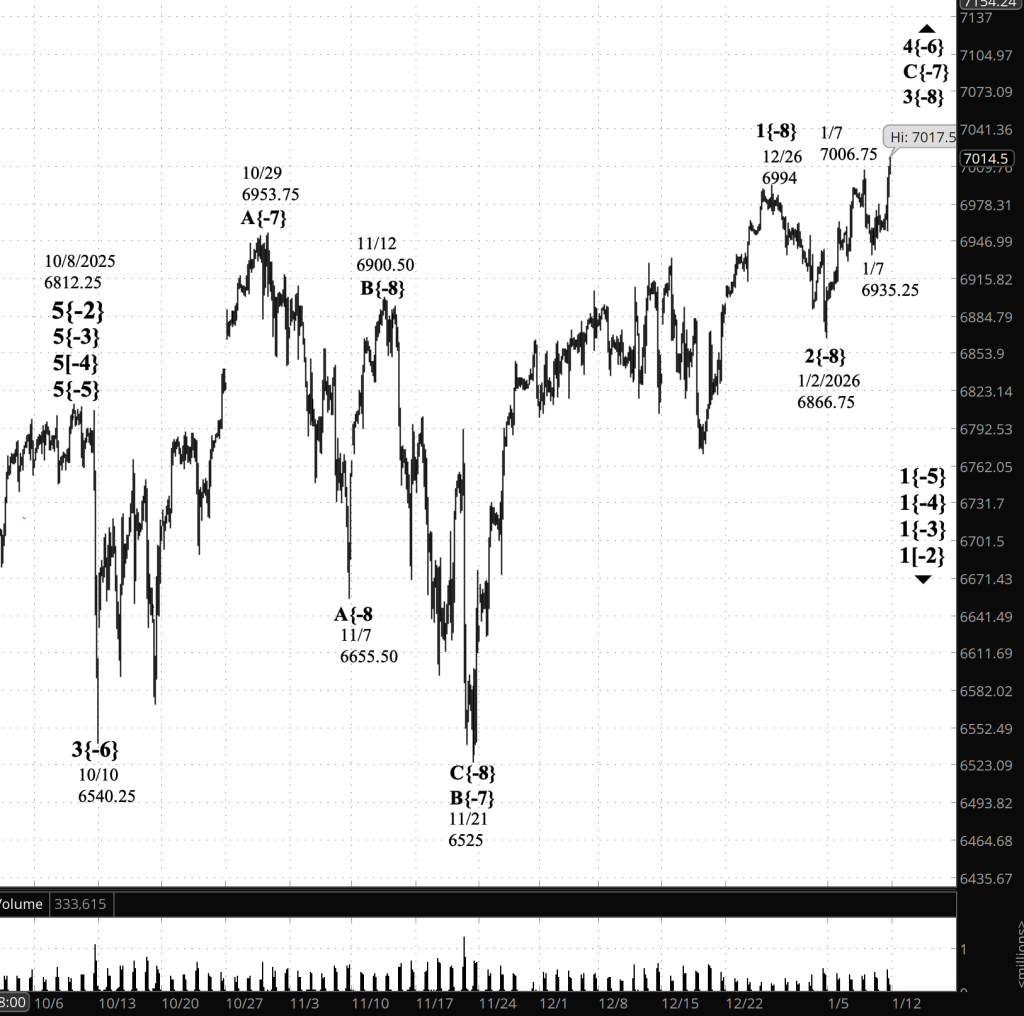
[S&P 500 E-mini futures at 3:30 p.m., 150-minute bars, with volume]
Waves Now Underway
These are the waves currently in progress under my principal analysis. Each line on the list shows the wave number, with the subscript in curly brackets, the traditional degree name, the starting date, the starting price of the S&P 500 E-mini futures, and the direction of the wave.
Most of the waves began not long ago, on October 8, 2025. See my essay posted on October 12, 2025, “The End of the Rise from 1932? Elliott Wave Theory Says ‘Yes’”, for a discussion of how that happened.
The difficult problem of estimating when a wave change should be accept as real rather than a headfake is addressed by the essay titled, “Is This Reversal Real?: How to Tell Without Being Whipsawed”.
- 1{+4} Supermillennium, (unknown start date or start price) {down}
- A hypothetical wave one degree higher than Supercyle, needed to make the wave analysis complete.
- S&P 500 Index:
- 1{+3} Supercycle, 10/8/2025, 6812.25 (down}
- 1{+2} Cycle, 10/8/2025, 6812.25 (down}
- 1{+1} Primary, 10/8/2025, 6812.25 (down}
- 1{0} Intermediate, 10/8/2025, 6812.25 (down}
- 1{-1} Minor, 10/8/2025, 6812.25 (down}
- 1{-2} Minute, 10/8/2025, 6812.25 (down}
- S&P 500 Futures
- 1{-3} Minuette 10/8/2025, 6812.25 (down}
- 1{-4} Subminutte 10/8/2025, 6812.25 (down}
- 1{-5} Micro, 10/8/2025, 6812.25 (down}
- 4{-6} Submicro, 10/10/2025, 6540.25 (up)
- C{-7} Minuscule, 11/21/2025, 6525 (up)
- 3{-8} (none), 1/2/2026, 6866.75 (up)
Reading the chart. Price movements — waves – – in Elliott Wave Theory analysis are labeled with numbers within trending waves and letters with corrective waves. The subscripts — numbers in curly brackets — designate the wave’s degree, which, in Elliott Wave analysis, means the relative position of a wave within the larger and smaller structures that make up the chart. R.N. Elliott, who in the 1930s developed the form of analysis that bears his name, viewed the chart as a complex structure of smaller waves nested within larger waves, which in turn are nested within still larger waves. In mathematics it’s called a fractal structure, where at every scale the pattern is similar to the others.
Learning and other resources. Elliott Wave analysis provides context, not prophecy. As the 20th century semanticist Alfred Korzybski put it in his book Science and Sanity (1933), “The map is not the territory … The only usefulness of a map depends on similarity of structure between the empirical world and the map.” And I would add, in the ever-changing markets, we can judge that similarity of structure only after the fact.
See the menu page Analytical Methods for a rundown on where to go for information on Elliott Wave analysis.
By Tim Bovee, Portland, Oregon, January 9, 2026
Disclaimer
Tim Bovee, Private Trader tracks the analysis and trades of a private trader for his own accounts. Nothing in this blog constitutes a recommendation to buy or sell stocks, options or any other financial instrument. The only purpose of this blog is to provide education and entertainment.
No trader is ever 100 percent successful in his or her trades. Trading in the stock and option markets is risky and uncertain. Each trader must make trading decisions for his or her own account, and take responsibility for the consequences.
All content on Tim Bovee, Private Trader by Timothy K. Bovee is licensed under a Creative Commons Attribution-ShareAlike 4.0 International License.
Based on work at www.timbovee.com

You must be logged in to post a comment.