3:30 p.m. New York time
Half an hour before the closing bell. The S&P 500 futures so far have risen to 7025.25 during today’s session—an all-time high that exceeds the prior peak (6994), reached on December 26, 2025.
Elliott Wave Theory: The new high confirms that wave 4{-6} remains underway—the upward correction that began on October 10, 2025 from 6540.25.
As long as the market holds above the prior breakout zone, the path of least resistance remains upward.
9:35 a.m. New York time.
What’s happening now. The S&P 500 E-mini futures resumed trading at 7007 Sunday evening and then dropped sharply, reaching an overnight low so far of 6950 and then rising to the 6970s.
The opening decline came after Federal Reserve Chair Jerome Powell made a statement that the U.S. Justice Dept. had opened an investigation into his testimony to Congress about the renovation of the Fed’s Washington, D.C. headquarters.
What does it mean? The decline was insufficient to trigger a change in how Elliott Wave Theory views the chart. Rising wave 3{-8} within rising wave C{-7}, both within upward correction wave 4{-6} remain underway.
The overnight drop was sharp and news-driven, but it hasn’t yet crossed the price lines that would force an Elliott Wave relabel—so the uptrend count remains the working model, with 6935.25 as the first hard test.
The AI ChatGPT listed these S&P 500 futures levels that are important today:
- 7017.5: most recent peak (the “make it or break it” overhead reference).
- 7008–7007: reopening area; reclaiming it cleanly would calm the tape.
- 6950: overnight low; if that breaks again, downside pressure is back on.
- 6935.25: the key line in the sand from your chart. A sustained break below here is the first thing that would start to pressure the “3{-8} still rising” assumption.
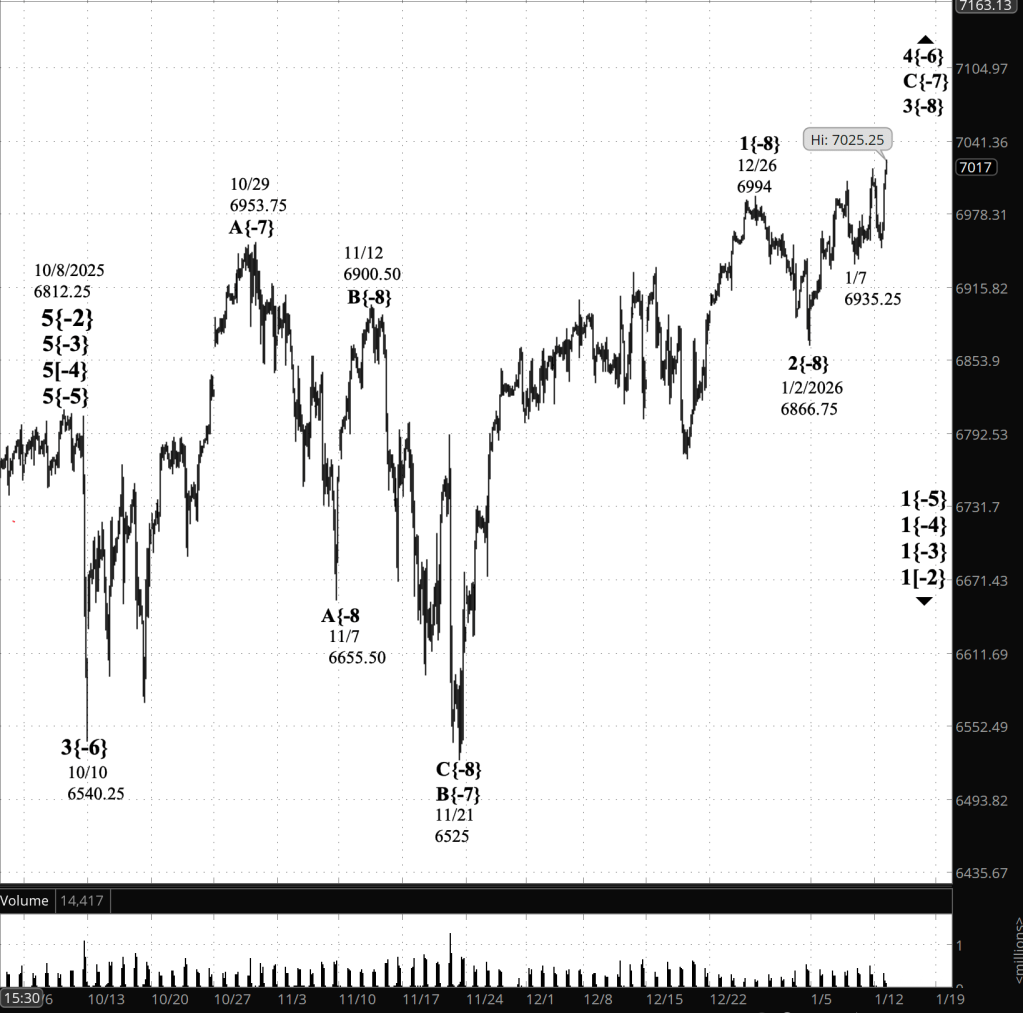
[S&P 500 E-mini futures at 3:30 p.m., 150-minute bars, with volume]
Waves Now Underway
These are the waves currently in progress under my principal analysis. Each line on the list shows the wave number, with the subscript in curly brackets, the traditional degree name, the starting date, the starting price of the S&P 500 E-mini futures, and the direction of the wave.
Most of the waves began not long ago, on October 8, 2025. See my essay posted on October 12, 2025, “The End of the Rise from 1932? Elliott Wave Theory Says ‘Yes’”, for a discussion of how that happened.
The difficult problem of estimating when a wave change should be accept as real rather than a headfake is addressed by the essay titled, “Is This Reversal Real?: How to Tell Without Being Whipsawed”.
- 1{+4} Supermillennium, (unknown start date or start price) {down}
- A hypothetical wave one degree higher than Supercyle, needed to make the wave analysis complete.
- S&P 500 Index:
- 1{+3} Supercycle, 10/8/2025, 6812.25 (down}
- 1{+2} Cycle, 10/8/2025, 6812.25 (down}
- 1{+1} Primary, 10/8/2025, 6812.25 (down}
- 1{0} Intermediate, 10/8/2025, 6812.25 (down}
- 1{-1} Minor, 10/8/2025, 6812.25 (down}
- 1{-2} Minute, 10/8/2025, 6812.25 (down}
- S&P 500 Futures
- 1{-3} Minuette 10/8/2025, 6812.25 (down}
- 1{-4} Subminutte 10/8/2025, 6812.25 (down}
- 1{-5} Micro, 10/8/2025, 6812.25 (down}
- 4{-6} Submicro, 10/10/2025, 6540.25 (up)
- C{-7} Minuscule, 11/21/2025, 6525 (up)
- 3{-8} (none), 1/2/2026, 6866.75 (up)
Reading the chart. Price movements — waves – – in Elliott Wave Theory analysis are labeled with numbers within trending waves and letters with corrective waves. The subscripts — numbers in curly brackets — designate the wave’s degree, which, in Elliott Wave analysis, means the relative position of a wave within the larger and smaller structures that make up the chart. R.N. Elliott, who in the 1930s developed the form of analysis that bears his name, viewed the chart as a complex structure of smaller waves nested within larger waves, which in turn are nested within still larger waves. In mathematics it’s called a fractal structure, where at every scale the pattern is similar to the others.
Learning and other resources. Elliott Wave analysis provides context, not prophecy. As the 20th century semanticist Alfred Korzybski put it in his book Science and Sanity (1933), “The map is not the territory … The only usefulness of a map depends on similarity of structure between the empirical world and the map.” And I would add, in the ever-changing markets, we can judge that similarity of structure only after the fact.
See the menu page Analytical Methods for a rundown on where to go for information on Elliott Wave analysis.
By Tim Bovee, Portland, Oregon, January 12, 2026
Disclaimer
Tim Bovee, Private Trader tracks the analysis and trades of a private trader for his own accounts. Nothing in this blog constitutes a recommendation to buy or sell stocks, options or any other financial instrument. The only purpose of this blog is to provide education and entertainment.
No trader is ever 100 percent successful in his or her trades. Trading in the stock and option markets is risky and uncertain. Each trader must make trading decisions for his or her own account, and take responsibility for the consequences.
All content on Tim Bovee, Private Trader by Timothy K. Bovee is licensed under a Creative Commons Attribution-ShareAlike 4.0 International License.
Based on work at www.timbovee.com

You must be logged in to post a comment.