3:30 p.m. New York time
Half an hour before the closing bell. The S&P 500 futures have worked their way lower since the CPI spike, falling from the post-release high of 7036.25 to a session low so far of 6983.50. Price is now chopping in the 6990s.
Elliott Wave Theory. On the 5-minute chart, the decline unfolds as a clean five-wave motive sequence, with the third wave the longest. So far, I am treating that selloff as a subwave within the larger upward correction that began on October 10, wave 4{-6}.
Key level. The pre-CPI base at 7007–7010 has now been broken. If price can reclaim that range and hold, the larger uptrend remains the higher-probability conclusion. If it cannot, then the odds increase that today’s decline is more than a brief subwave and may be the start of a deeper pullback.
Today’s CPI whipsaw looks less like ‘one spike and done’ and more like a volatility pivot day—trend clarity will come from whether 7007–7010 can be regained.
9:35 a.m. New York time.
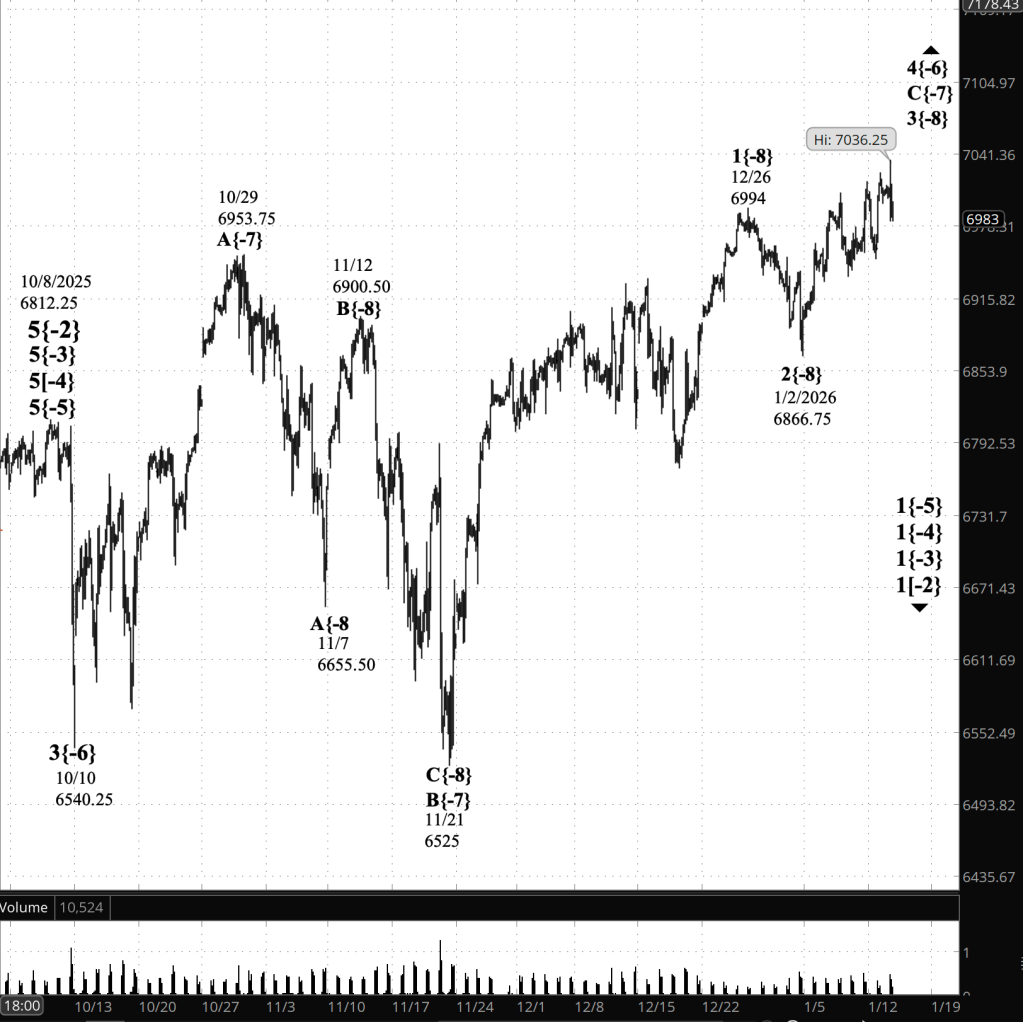
What’s happening now. The S&P 500 E-mini futures reached an overnight low of 6998.75 early in the session, then traded mostly between 7000 and the 7010s until the Consumer Price Index report was published an hour before the opening bell. Price then shot up to 7036.25 and just as quickly declined back into the 7010s and 7020s.
What does it mean? In Elliott Wave terms, the sharp rise and decline appear to be a small subwave within the upward correction that began on October 10, wave 4{-6}. The correction is presently in wave C{-7}, which in turn is in its third of five subwaves, wave 3{-8}, all rising.
Key level. As long as price remains above the 7007–7010 range—where futures were trading before the CPI release—the uptrend remains the higher-probability read. If price moves below that range and fails to recover it, the uptrend becomes less certain and the odds increase of a deeper pullback.
[S&P 500 E-mini futures at 3:30 p.m., 150-minute bars, with volume]
Waves Now Underway
These are the waves currently in progress under my principal analysis. Each line on the list shows the wave number, with the subscript in curly brackets, the traditional degree name, the starting date, the starting price of the S&P 500 E-mini futures, and the direction of the wave.
Most of the waves began not long ago, on October 8, 2025. See my essay posted on October 12, 2025, “The End of the Rise from 1932? Elliott Wave Theory Says ‘Yes’”, for a discussion of how that happened.
The difficult problem of estimating when a wave change should be accept as real rather than a headfake is addressed by the essay titled, “Is This Reversal Real?: How to Tell Without Being Whipsawed”.
- 1{+4} Supermillennium, (unknown start date or start price) {down}
- A hypothetical wave one degree higher than Supercyle, needed to make the wave analysis complete.
- S&P 500 Index:
- 1{+3} Supercycle, 10/8/2025, 6812.25 (down}
- 1{+2} Cycle, 10/8/2025, 6812.25 (down}
- 1{+1} Primary, 10/8/2025, 6812.25 (down}
- 1{0} Intermediate, 10/8/2025, 6812.25 (down}
- 1{-1} Minor, 10/8/2025, 6812.25 (down}
- 1{-2} Minute, 10/8/2025, 6812.25 (down}
- S&P 500 Futures
- 1{-3} Minuette 10/8/2025, 6812.25 (down}
- 1{-4} Subminutte 10/8/2025, 6812.25 (down}
- 1{-5} Micro, 10/8/2025, 6812.25 (down}
- 4{-6} Submicro, 10/10/2025, 6540.25 (up)
- C{-7} Minuscule, 11/21/2025, 6525 (up)
- 3{-8} (none), 1/2/2026, 6866.75 (up)
Reading the chart. Price movements — waves – – in Elliott Wave Theory analysis are labeled with numbers within trending waves and letters with corrective waves. The subscripts — numbers in curly brackets — designate the wave’s degree, which, in Elliott Wave analysis, means the relative position of a wave within the larger and smaller structures that make up the chart. R.N. Elliott, who in the 1930s developed the form of analysis that bears his name, viewed the chart as a complex structure of smaller waves nested within larger waves, which in turn are nested within still larger waves. In mathematics it’s called a fractal structure, where at every scale the pattern is similar to the others.
Learning and other resources. Elliott Wave analysis provides context, not prophecy. As the 20th century semanticist Alfred Korzybski put it in his book Science and Sanity (1933), “The map is not the territory … The only usefulness of a map depends on similarity of structure between the empirical world and the map.” And I would add, in the ever-changing markets, we can judge that similarity of structure only after the fact.
See the menu page Analytical Methods for a rundown on where to go for information on Elliott Wave analysis.
By Tim Bovee, Portland, Oregon, January 13, 2026
Disclaimer
Tim Bovee, Private Trader tracks the analysis and trades of a private trader for his own accounts. Nothing in this blog constitutes a recommendation to buy or sell stocks, options or any other financial instrument. The only purpose of this blog is to provide education and entertainment.
No trader is ever 100 percent successful in his or her trades. Trading in the stock and option markets is risky and uncertain. Each trader must make trading decisions for his or her own account, and take responsibility for the consequences.
All content on Tim Bovee, Private Trader by Timothy K. Bovee is licensed under a Creative Commons Attribution-ShareAlike 4.0 International License.
Based on work at www.timbovee.com

You must be logged in to post a comment.