Market Holiday. The U.S. markets are closed today in observance of Martin Luther King Jr. Day. The S&P 500 futures resumed trading Sunday evening, and remained active into Monday.
10 a.m. New York time
The S&P 500 futures close. The holiday session ended at 10 a.m. Futures reached a morning low of 6887.50, then reversed higher, rising to 6915.75 before the close. The rebound was too shallow to overturn this morning’s conclusion: a downtrending corrective wave 4{-8} is underway.
I’ve posted a short-term chart with 5-minute bars to show the course of today’s trading.
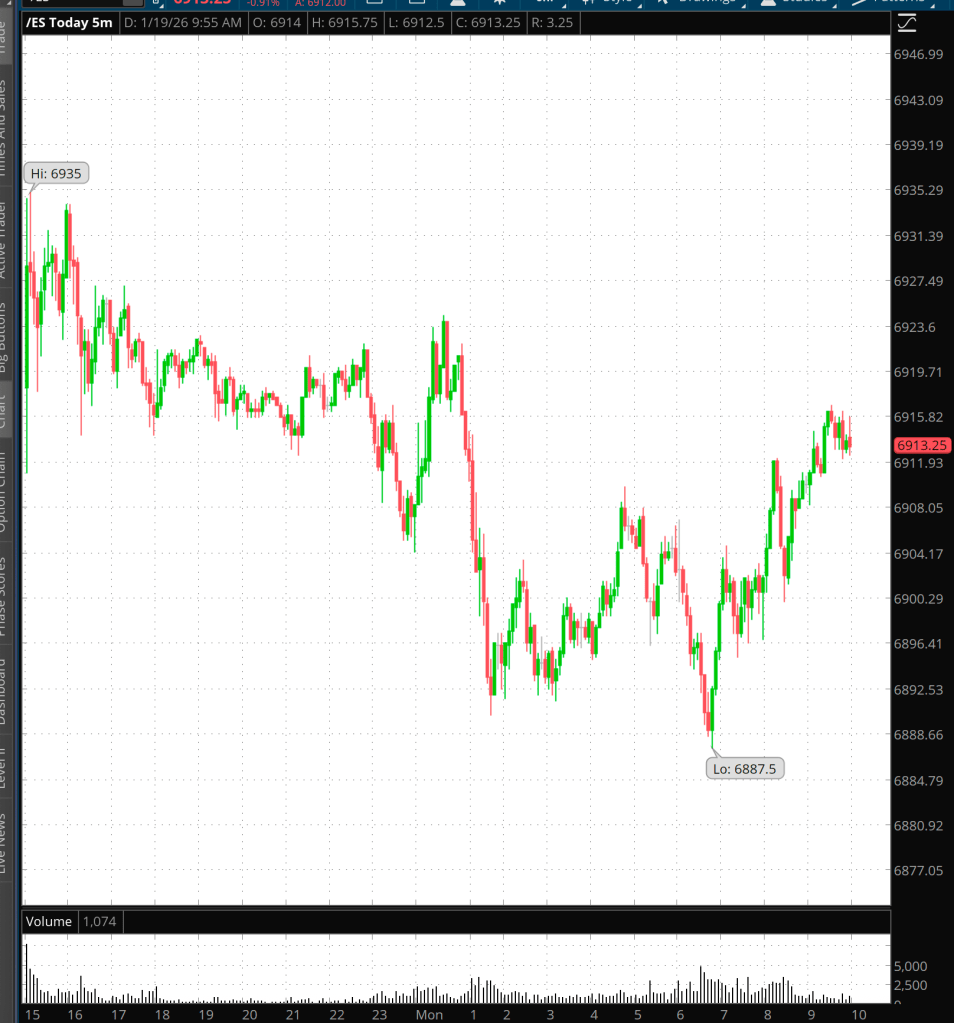
[S&P 500 E-mini futures at 10 a.m., 5-minute bars, with volume]
9:35 a.m. New York time.
What’s happening now. The S&P 500 E-mini futures reopened Sunday evening with a 59.5-point gap down. The decllne continued, so far reaching a low of 6890.25. The total drop as of now is 87.50.
What does it mean? The decline resolves the Elliott Wave Theory ambiguity that had plagued the chart for days. The uptrending 3rd wave that began on January 2 from 6866.75 ended on January 13 at 7036.25. A 4th-wave downward correction began at that point, on that date, and is still underway.
The waves in play are wave 3{-8} and 4{-8}, both within rising wave C{-7}, which began on November 21, 2025 from 6525, and wave 4{-6}, an upward correction that began on October 10, 2025 from 6540.25.
The analysis on Friday, based on Fibonacci levels and wave lengths within the structure, had determend that a move below 6923.25 would be confirmation that wave 4{-8} is underway. The chart as of this writing is 33 points below that level.
Why the gap? The Monday morning news report attribute it to President Trump saying Saturday on social media that he would impose 10% tariffs on eight European countries if they were continue opposing his plan for the U.S. to take over governance of Greenland. The countries are Denmark, France, Finland, Germany, the Netherlands, Norway, Sweden, and the U.K.
Sunday’s gap-down is a reminder that political developments can still matter quickly and disproportionately for prices. One plausible explanation is that traders used the thin overnight session to reprice policy and geopolitical uncertainty; if so, the move may be less a “technical decision” than a sudden shift in perceived risk. Either way, the practical takeaway is the same: this week our stance can’t be set once and forgotten—caution versus participation, and even “no trade,” will be a daily decision.
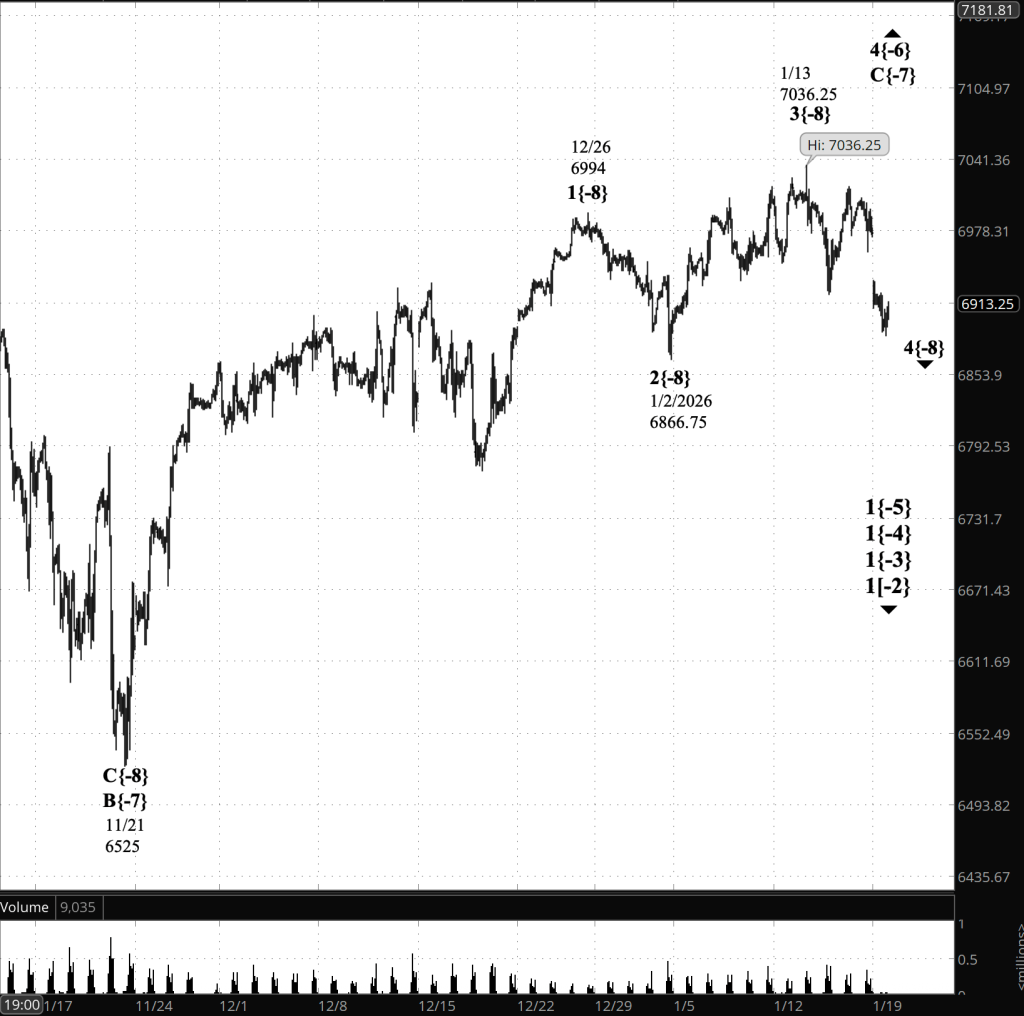
[S&P 500 E-mini futures at 10 a.m., 90-minute bars, with volume]
Waves Now Underway
These are the waves currently in progress under my principal analysis. Each line on the list shows the wave number, with the subscript in curly brackets, the traditional degree name, the starting date, the starting price of the S&P 500 E-mini futures, and the direction of the wave.
Most of the waves began not long ago, on October 8, 2025. See my essay posted on October 12, 2025, “The End of the Rise from 1932? Elliott Wave Theory Says ‘Yes’”, for a discussion of how that happened.
The difficult problem of estimating when a wave change should be accept as real rather than a headfake is addressed by the essay titled, “Is This Reversal Real?: How to Tell Without Being Whipsawed”.
- 1{+4} Supermillennium, (unknown start date or start price) {down}
- A hypothetical wave one degree higher than Supercyle, needed to make the wave analysis complete.
- S&P 500 Index:
- 1{+3} Supercycle, 10/8/2025, 6812.25 (down}
- 1{+2} Cycle, 10/8/2025, 6812.25 (down}
- 1{+1} Primary, 10/8/2025, 6812.25 (down}
- 1{0} Intermediate, 10/8/2025, 6812.25 (down}
- 1{-1} Minor, 10/8/2025, 6812.25 (down}
- 1{-2} Minute, 10/8/2025, 6812.25 (down}
- S&P 500 Futures
- 1{-3} Minuette 10/8/2025, 6812.25 (down}
- 1{-4} Subminutte 10/8/2025, 6812.25 (down}
- 1{-5} Micro, 10/8/2025, 6812.25 (down}
- 4{-6} Submicro, 10/10/2025, 6540.25 (up)
- C{-7} Minuscule, 11/21/2025, 6525 (up)
- 4{-8} (none), 1/13/2026, 7036.25 (down)
Reading the chart. Price movements — waves – – in Elliott Wave Theory analysis are labeled with numbers within trending waves and letters with corrective waves. The subscripts — numbers in curly brackets — designate the wave’s degree, which, in Elliott Wave analysis, means the relative position of a wave within the larger and smaller structures that make up the chart. R.N. Elliott, who in the 1930s developed the form of analysis that bears his name, viewed the chart as a complex structure of smaller waves nested within larger waves, which in turn are nested within still larger waves. In mathematics it’s called a fractal structure, where at every scale the pattern is similar to the others.
Learning and other resources. Elliott Wave analysis provides context, not prophecy. As the 20th century semanticist Alfred Korzybski put it in his book Science and Sanity (1933), “The map is not the territory … The only usefulness of a map depends on similarity of structure between the empirical world and the map.” And I would add, in the ever-changing markets, we can judge that similarity of structure only after the fact.
See the menu page Analytical Methods for a rundown on where to go for information on Elliott Wave analysis.
By Tim Bovee, Portland, Oregon, January 19, 2026
Disclaimer
Tim Bovee, Private Trader tracks the analysis and trades of a private trader for his own accounts. Nothing in this blog constitutes a recommendation to buy or sell stocks, options or any other financial instrument. The only purpose of this blog is to provide education and entertainment.
No trader is ever 100 percent successful in his or her trades. Trading in the stock and option markets is risky and uncertain. Each trader must make trading decisions for his or her own account, and take responsibility for the consequences.
All content on Tim Bovee, Private Trader by Timothy K. Bovee is licensed under a Creative Commons Attribution-ShareAlike 4.0 International License.
Based on work at www.timbovee.com

You must be logged in to post a comment.