3:30 p.m. New York time
Half an hour before the closing bell. The S&P 500 futures rose slightly early in the session and then resumed their downward march, so far reaching into the 6820s.
Elliott Wave Theory: Downtrending corrective wave 4{-8} continues. The decline has now moved below the first Fibonacci retracement target (38.2% of the prior advance), which keeps the correction’s momentum intact. The next likely stopping zones are 6781 (50%) and 6720 (61.8%); a deeper “stretch” level is 6634 (78.6%). I will watch for basing or reversal structure at each level; absent that, the odds favor continuation to the next zone.
9:35 a.m. New York time.
What’s happening now. The S&P 500 E-mini futures declined overnight, from 6916.50 into the 6840s.
What does it mean? Elliott Wave Theory continues to see downtrending wave 4{-8} underway. The decline began on January 13 from 7036.25, then rose a bit at the opening bell. This corrective wave is a subwave of rising wave C{-7}, which is in turn a subwave of the broader upward correction, wave 4{-6}, which began on October 10, 2025 from 6540.25.
The AI ChatGPT analyzed the chart with the goal of estimating how far the price might fall. ChatGPT writes:
To estimate how far wave 4{-8} might travel, I measure how much it is retracing the prior advance it is correcting—namely rising wave C{-7} (6525 on 11/21 to 7036.25 on 1/13). A common method is Fibonacci retracement: markets often pause or reverse after giving back about 38%, 50%, or 62% of the prior move. Wave C{-7} spans 511.25 points, so the key retracement targets from the 7036.25 peak are: 38.2% at 6840.95 (already reached), 50% at 6780.63, 61.8% at 6720.30, and a deeper “stretch” level at 78.6%: 6634.41. These are not certainties; they are likely stopping zones where I will watch for basing, reversal structure, or a breakdown to the next level.
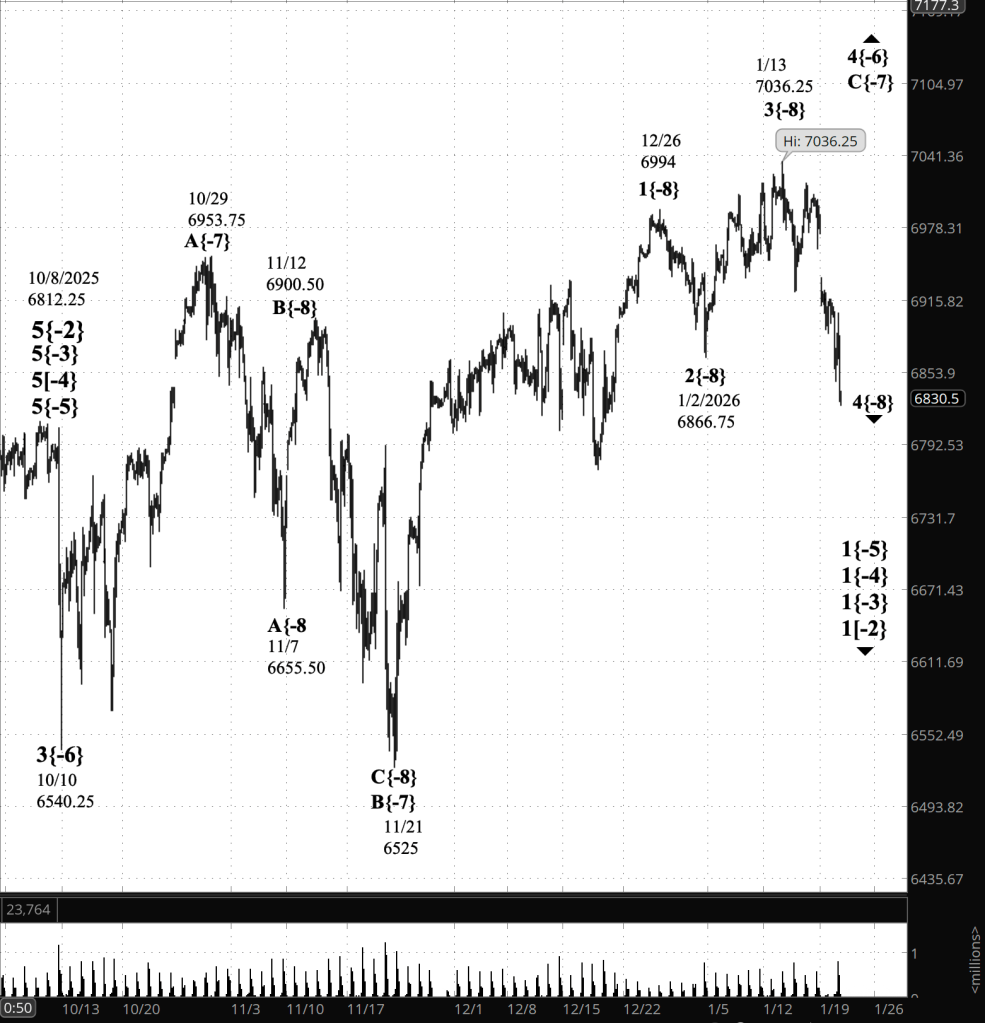
[S&P 500 E-mini futures at 3:30 p.m., 160-minute bars, with volume]
Waves Now Underway
These are the waves currently in progress under my principal analysis. Each line on the list shows the wave number, with the subscript in curly brackets, the traditional degree name, the starting date, the starting price of the S&P 500 E-mini futures, and the direction of the wave.
Most of the waves began not long ago, on October 8, 2025. See my essay posted on October 12, 2025, “The End of the Rise from 1932? Elliott Wave Theory Says ‘Yes’”, for a discussion of how that happened.
The difficult problem of estimating when a wave change should be accept as real rather than a headfake is addressed by the essay titled, “Is This Reversal Real?: How to Tell Without Being Whipsawed”.
- 1{+4} Supermillennium, (unknown start date or start price) {down}
- A hypothetical wave one degree higher than Supercyle, needed to make the wave analysis complete.
- S&P 500 Index:
- 1{+3} Supercycle, 10/8/2025, 6812.25 (down}
- 1{+2} Cycle, 10/8/2025, 6812.25 (down}
- 1{+1} Primary, 10/8/2025, 6812.25 (down}
- 1{0} Intermediate, 10/8/2025, 6812.25 (down}
- 1{-1} Minor, 10/8/2025, 6812.25 (down}
- 1{-2} Minute, 10/8/2025, 6812.25 (down}
- S&P 500 Futures
- 1{-3} Minuette 10/8/2025, 6812.25 (down}
- 1{-4} Subminutte 10/8/2025, 6812.25 (down}
- 1{-5} Micro, 10/8/2025, 6812.25 (down}
- 4{-6} Submicro, 10/10/2025, 6540.25 (up)
- C{-7} Minuscule, 11/21/2025, 6525 (up)
- 4{-8} (none), 1/13/2026, 7036.25 (down)
Reading the chart. Price movements — waves – – in Elliott Wave Theory analysis are labeled with numbers within trending waves and letters with corrective waves. The subscripts — numbers in curly brackets — designate the wave’s degree, which, in Elliott Wave analysis, means the relative position of a wave within the larger and smaller structures that make up the chart. R.N. Elliott, who in the 1930s developed the form of analysis that bears his name, viewed the chart as a complex structure of smaller waves nested within larger waves, which in turn are nested within still larger waves. In mathematics it’s called a fractal structure, where at every scale the pattern is similar to the others.
Learning and other resources. Elliott Wave analysis provides context, not prophecy. As the 20th century semanticist Alfred Korzybski put it in his book Science and Sanity (1933), “The map is not the territory … The only usefulness of a map depends on similarity of structure between the empirical world and the map.” And I would add, in the ever-changing markets, we can judge that similarity of structure only after the fact.
See the menu page Analytical Methods for a rundown on where to go for information on Elliott Wave analysis.
By Tim Bovee, Portland, Oregon, January 20, 2026
Disclaimer
Tim Bovee, Private Trader tracks the analysis and trades of a private trader for his own accounts. Nothing in this blog constitutes a recommendation to buy or sell stocks, options or any other financial instrument. The only purpose of this blog is to provide education and entertainment.
No trader is ever 100 percent successful in his or her trades. Trading in the stock and option markets is risky and uncertain. Each trader must make trading decisions for his or her own account, and take responsibility for the consequences.
All content on Tim Bovee, Private Trader by Timothy K. Bovee is licensed under a Creative Commons Attribution-ShareAlike 4.0 International License.
Based on work at www.timbovee.com

You must be logged in to post a comment.