3:30 p.m. New York time
Half an hour before the closing bell. The S&P 500 futures rose early, reaching 6969, and then slipped back into the mid-6940s. Net: A mostly sideways session—plenty of motion, little progress.
Elliott Wave Theory. The analysis is unchanged. Rising wave B{-9} continues as the middle subwave of the upward correction, wave 4{-8}. Today’s action reads as corrective: choppy, overlapping, and lacking follow-through.
Key levels (near-term). Today’s high is the upside reference. A clean break and hold above it would strengthen the case that B{-9} still has room to run. Failure to hold the mid-6940s keeps the “stalling” narrative intact and would raise the odds of a deeper pullback within the B-wave.
A trading day of sound and fury, but not much progress—signifying very little. (With a nod to William Shakespeare’s play “Macbeth”.)
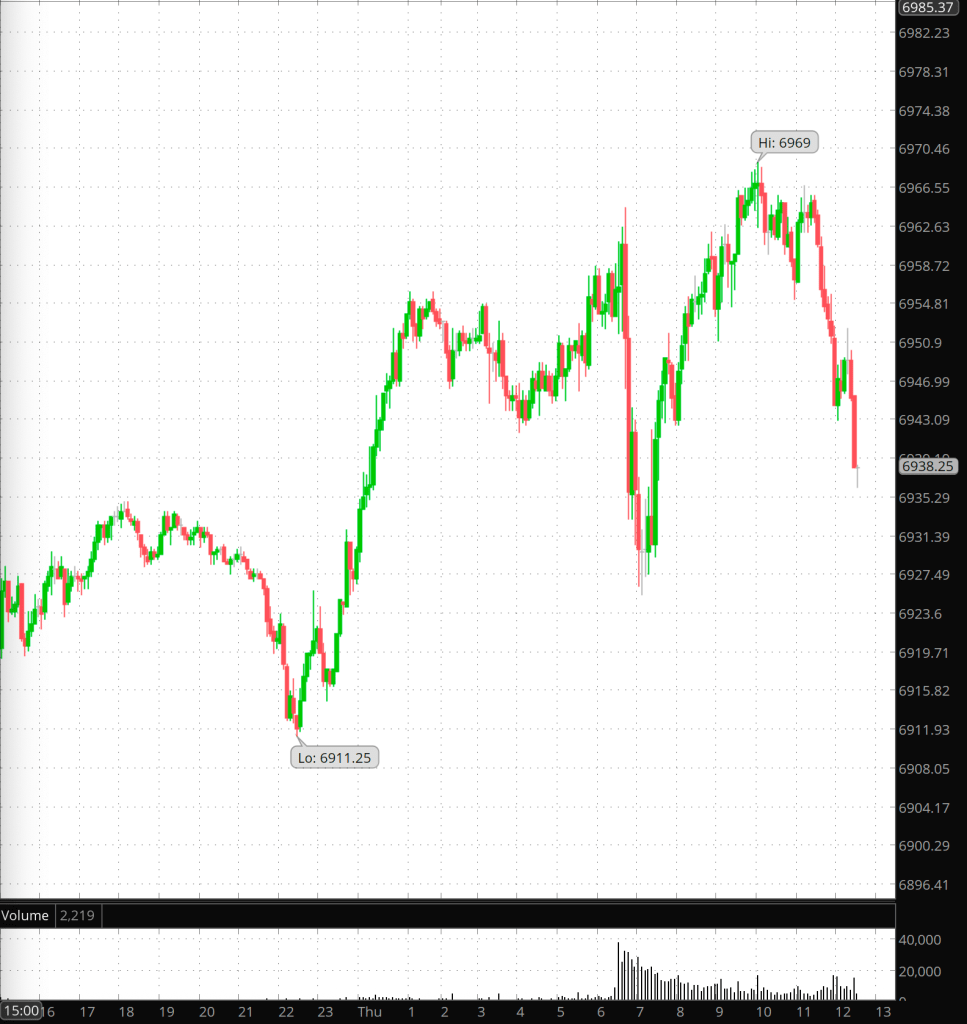
[S&P 500 E-mini futures at 3:30 p.m., 5-minute bars, with volume]
9:35 a.m. New York time.
What’s happening now. The S&P 500 E-mini futures opened the overnight session at 6945, declined to an overnight low of 6911.25, and then reversed and rose back into the 6950s as the opening bell approached. The move looks dramatic in miniature, but in net terms the futures have barely budged. Overnight was motion without progress.
What does it mean? When the market can travel 30–40 points and end up essentially unchanged, it is usually signaling “waiting for the next shove.” With a dense economic calendar this morning, that shove is likely to come from the data.
Elliott Wave Theory: The analysis is unchanged: Wave 4{-8}, a downward correction, remains underway.
Within wave 4{-8}, the subwave picture is less clear. The most likely interpretation is that the first subwave, wave A{-9}, ended on January 21 at 6814.50, and rising wave B{-9} is now underway. Since the A-wave subdivided into three waves, the principal interpretation is that wave 4{-8} is taking the form of a Flat (3-3-5).
Alternatively—less likely in my view—it’s possible that wave 4{-8} ended on January 21, and that rising wave 5{-8} has begun. This would imply a relatively short wave 4{-8}. For now, I lean strongly toward the principal interpretation.
Risk factors. At 8:30 a.m. ET we get Initial Jobless Claims and the GDP first revision. At 10:00 a.m. ET we get a series of PCE reports. I’m treating the interval from 8:30 through shortly after 10:00 as the decision window—first impulse, reaction, and then the second move that often reveals what traders actually believe.
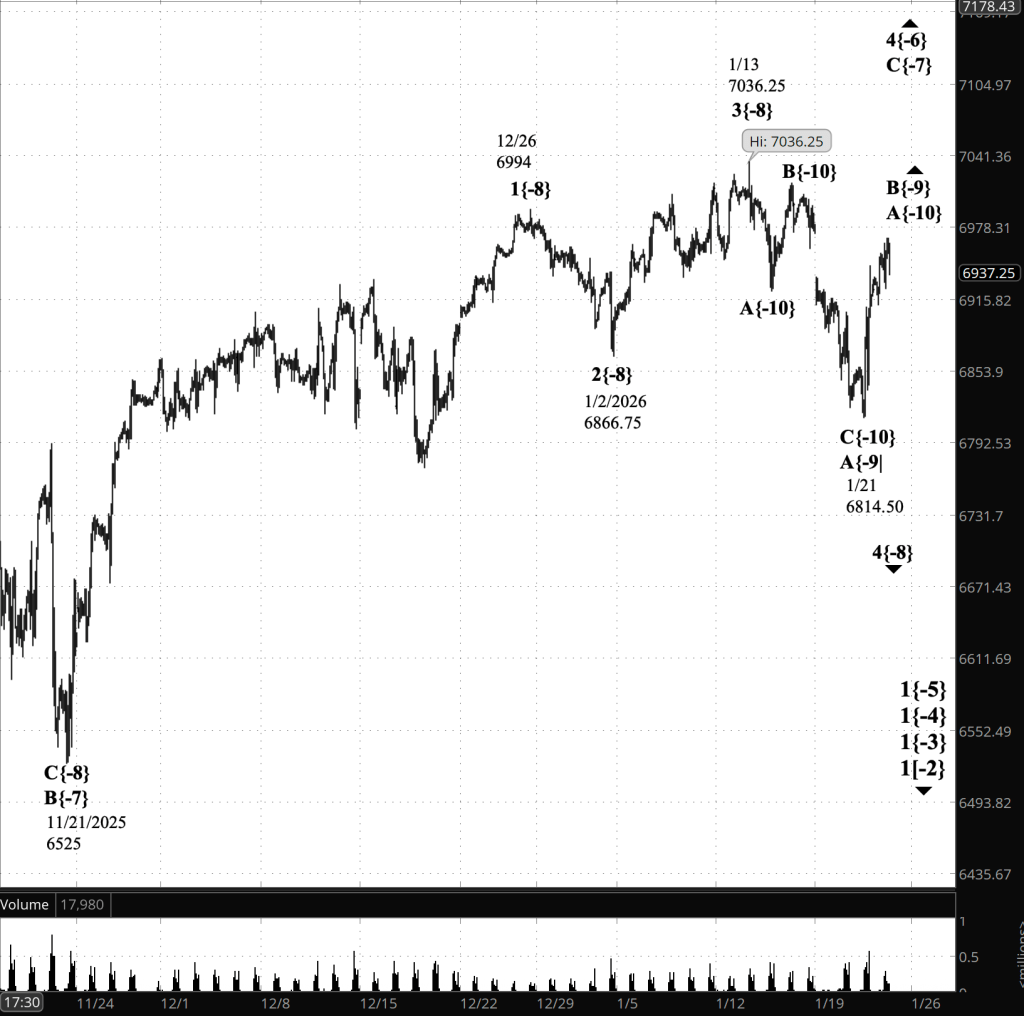
[S&P 500 E-mini futures at 3:30 p.m., 90-minute bars, with volume]
Waves Now Underway
These are the waves currently in progress under my principal analysis. Each line on the list shows the wave number, with the subscript in curly brackets, the traditional degree name, the starting date, the starting price of the S&P 500 E-mini futures, and the direction of the wave.
Most of the waves began not long ago, on October 8, 2025. See my essay posted on October 12, 2025, “The End of the Rise from 1932? Elliott Wave Theory Says ‘Yes’”, for a discussion of how that happened.
The difficult problem of estimating when a wave change should be accept as real rather than a headfake is addressed by the essay titled, “Is This Reversal Real?: How to Tell Without Being Whipsawed”.
- 1{+4} Supermillennium, (unknown start date or start price) {down}
- A hypothetical wave one degree higher than Supercyle, needed to make the wave analysis complete.
- S&P 500 Index:
- 1{+3} Supercycle, 10/8/2025, 6812.25 (down}
- 1{+2} Cycle, 10/8/2025, 6812.25 (down}
- 1{+1} Primary, 10/8/2025, 6812.25 (down}
- 1{0} Intermediate, 10/8/2025, 6812.25 (down}
- 1{-1} Minor, 10/8/2025, 6812.25 (down}
- 1{-2} Minute, 10/8/2025, 6812.25 (down}
- S&P 500 Futures
- 1{-3} Minuette 10/8/2025, 6812.25 (down}
- 1{-4} Subminutte 10/8/2025, 6812.25 (down}
- 1{-5} Micro, 10/8/2025, 6812.25 (down}
- 4{-6} Submicro, 10/10/2025, 6540.25 (up)
- C{-7} Minuscule, 11/21/2025, 6525 (up)
- 4{-8} (none), 1/13/2026, 7036.25 (down)
- B{-9} (none), 1/21/2026, 6814-50 (up)
- A{-10} (none), 1/21/2026, 6814-50 (up)
Reading the chart. Price movements — waves – – in Elliott Wave Theory analysis are labeled with numbers within trending waves and letters with corrective waves. The subscripts — numbers in curly brackets — designate the wave’s degree, which, in Elliott Wave analysis, means the relative position of a wave within the larger and smaller structures that make up the chart. R.N. Elliott, who in the 1930s developed the form of analysis that bears his name, viewed the chart as a complex structure of smaller waves nested within larger waves, which in turn are nested within still larger waves. In mathematics it’s called a fractal structure, where at every scale the pattern is similar to the others.
Learning and other resources. Elliott Wave analysis provides context, not prophecy. As the 20th century semanticist Alfred Korzybski put it in his book Science and Sanity (1933), “The map is not the territory … The only usefulness of a map depends on similarity of structure between the empirical world and the map.” And I would add, in the ever-changing markets, we can judge that similarity of structure only after the fact.
See the menu page Analytical Methods for a rundown on where to go for information on Elliott Wave analysis.
By Tim Bovee, Portland, Oregon, January 22, 2026
Disclaimer
Tim Bovee, Private Trader tracks the analysis and trades of a private trader for his own accounts. Nothing in this blog constitutes a recommendation to buy or sell stocks, options or any other financial instrument. The only purpose of this blog is to provide education and entertainment.
No trader is ever 100 percent successful in his or her trades. Trading in the stock and option markets is risky and uncertain. Each trader must make trading decisions for his or her own account, and take responsibility for the consequences.
All content on Tim Bovee, Private Trader by Timothy K. Bovee is licensed under a Creative Commons Attribution-ShareAlike 4.0 International License.
Based on work at www.timbovee.com

You must be logged in to post a comment.