3:30 p.m. New York time
Half an hour before the closing bell. The S&P 500 E-mini futures sold off sharply during the session, then bounced off the lows, trading near 6922.
Elliott Wave Theory: The decline strengthens the case that falling wave C{-9} is underway. The alternative—another push higher within the broader B{-9} correction—remains possible, but still unconfirmed without a decisive move back above 7043 (the January 27 high). At the {-10} degree, the prior labeling implied wave B{-10} moved below the end of wave A{-10}, which is not allowed. To resolve that, I’m marking the February 3 peak (7027.25) as the end of wave B{-10}, and labeling the subsequent decline as wave C{-10}, now underway.
9:35 a.m. New York time.
What’s happening now. The S&P 500 E-mini futures continued to rise overnight, from 6931.25 to 6965.75.
What does it mean? Elliott Wave Theory reads the overnight rise as a subwave of wave B{-10}, which is itself a subwave of wave C{-9}—the final subwave of wave 4{-8}, the downward correction that began on January 13.
A characteristic of Elliott Wave Theory is that it identifies patterns that have occurred, and patterns that tend to follow—but it does not attach those patterns to time or distance. So an ongoing wave can look “done” when it isn’t, and a completed wave can look “still underway” when it isn’t. Only the passage of time (and the next confirmations/invalidations) can unravel the ambiguity.
As noted in yesterday’s analysis, labeling the decline that began on January 27 as falling wave C{-9} remains tentative. It is still possible that the decline is a subwave of rising wave B{-9}.
Here are the decision points.
Upside confirmation (B{-9} revival / C{-9} doubt increases):
- 6965.75 (overnight high):
- A clean push above and hold above suggests B{-10} is still extending upward (more than just noise).
- 7009–7027.25 (resistance band; 2/3 high marked 7027.25):
- Reclaiming this area would materially weaken the “we’re already in C{-9} down” narrative.
- 7043 (Jan 27 high = the “line in the sand” you’ve been using):
- Above 7043 = strongest confirmation that B{-9} is still underway (and that the late-Jan/early-Feb drop was corrective inside it, not the start of a larger C{-9} decline).
Downside confirmation (C{-9} strengthens / 4{-8} still working lower):
- 6931.25 (overnight low):
- A decisive break below, with no quick reclaim, is your near-term signal that the overnight pop was just a subwave and sellers are regaining control.
- 6915–6916 area (near the next visible shelf on your 30m scale):
- Losing this tends to open the door to a fast test of the bigger lows.
- 6886 (2/3 low):
- Below 6886 is the first “serious” confirmation that the market is leaning into the C{-9} path again.
- 6864.50 (2/1 low):
- Below 6864.50 strengthens the case that C{-9} is not just “possible,” but actively pushing toward completion of 4{-8}.
- 6814.50 (1/21 low):
- A break of 6814.50 would be a major escalation: it argues the correction is not finishing—it’s extending.
Practically speaking: Until the price leaves the 6931–6966 overnight box decisively, the most honest label is still “range + ambiguity.”
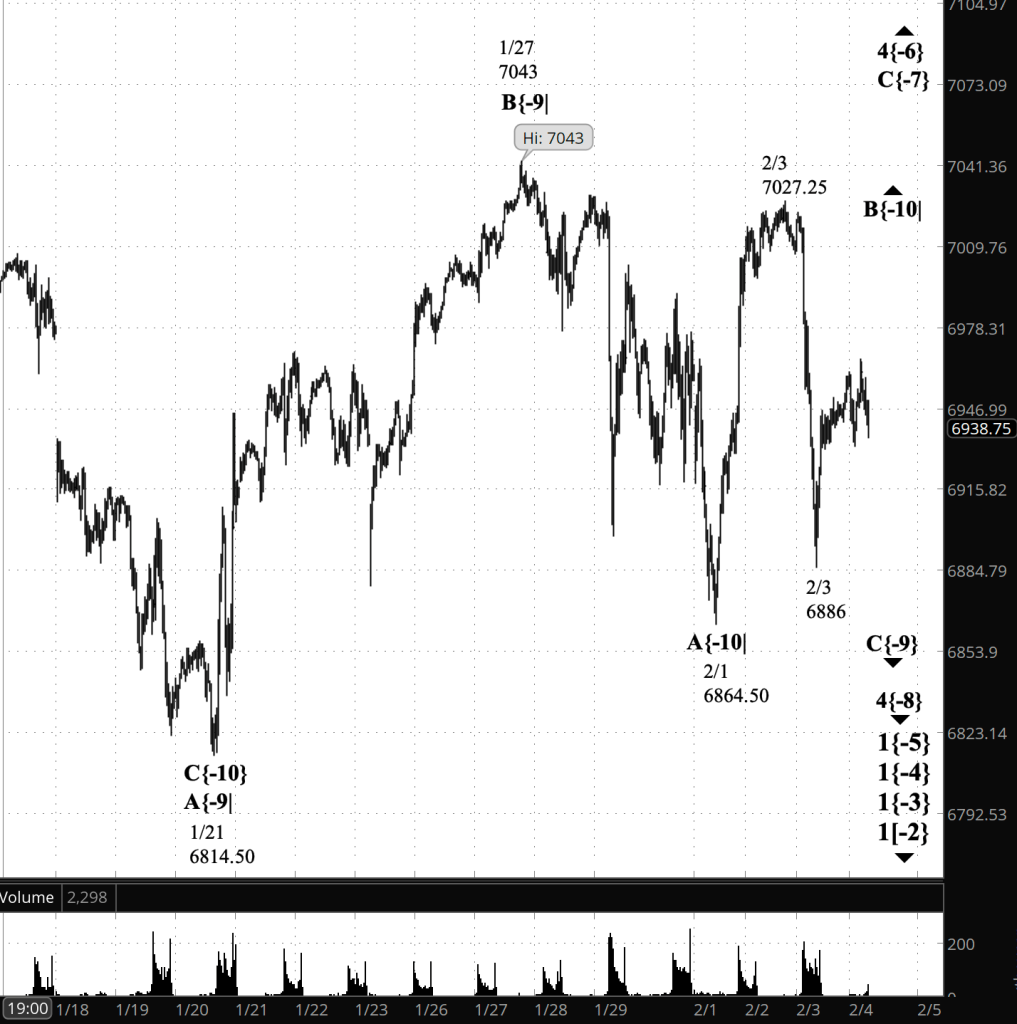
[S&P 500 E-mini futures at 3:30 p.m., 25-minute bars, with volume]
Waves Now Underway
These are the waves currently in progress under my principal analysis. Each line on the list shows the wave number, with the subscript in curly brackets, the traditional degree name, the starting date, the starting price of the S&P 500 E-mini futures, and the direction of the wave.
Most of the waves began not long ago, on October 8, 2025. See my essay posted on October 12, 2025, “The End of the Rise from 1932? Elliott Wave Theory Says ‘Yes’”, for a discussion of how that happened.
The difficult problem of estimating when a wave change should be accept as real rather than a headfake is addressed by the essay titled, “Is This Reversal Real?: How to Tell Without Being Whipsawed”.
- 1{+4} Supermillennium, (unknown start date or start price) {down}
- A hypothetical wave one degree higher than Supercyle, needed to make the wave analysis complete.
- S&P 500 Index:
- 1{+3} Supercycle, 10/8/2025, 6812.25 (down}
- 1{+2} Cycle, 10/8/2025, 6812.25 (down}
- 1{+1} Primary, 10/8/2025, 6812.25 (down}
- 1{0} Intermediate, 10/8/2025, 6812.25 (down}
- 1{-1} Minor, 10/8/2025, 6812.25 (down}
- 1{-2} Minute, 10/8/2025, 6812.25 (down}
- S&P 500 Futures
- 1{-3} Minuette 10/8/2025, 6812.25 (down}
- 1{-4} Subminutte 10/8/2025, 6812.25 (down}
- 1{-5} Micro, 10/8/2025, 6812.25 (down}
- 4{-6} Submicro, 10/10/2025, 6540.25 (up)
- C{-7} Minuscule, 11/21/2025, 6525 (up)
- 4{-8} (none), 1/13/2026, 7036.25 (down)
- C{-9} (none), 1/27/2026, 7043 (down)
Reading the chart. Price movements — waves – – in Elliott Wave Theory analysis are labeled with numbers within trending waves and letters with corrective waves. The subscripts — numbers in curly brackets — designate the wave’s degree, which, in Elliott Wave analysis, means the relative position of a wave within the larger and smaller structures that make up the chart. R.N. Elliott, who in the 1930s developed the form of analysis that bears his name, viewed the chart as a complex structure of smaller waves nested within larger waves, which in turn are nested within still larger waves. In mathematics it’s called a fractal structure, where at every scale the pattern is similar to the others.
Learning and other resources. Elliott Wave analysis provides context, not prophecy. As the 20th century semanticist Alfred Korzybski put it in his book Science and Sanity (1933), “The map is not the territory … The only usefulness of a map depends on similarity of structure between the empirical world and the map.” And I would add, in the ever-changing markets, we can judge that similarity of structure only after the fact.
See the menu page Analytical Methods for a rundown on where to go for information on Elliott Wave analysis.
By Tim Bovee, Portland, Oregon, February 4, 2026
Disclaimer
Tim Bovee, Private Trader tracks the analysis and trades of a private trader for his own accounts. Nothing in this blog constitutes a recommendation to buy or sell stocks, options or any other financial instrument. The only purpose of this blog is to provide education and entertainment.
No trader is ever 100 percent successful in his or her trades. Trading in the stock and option markets is risky and uncertain. Each trader must make trading decisions for his or her own account, and take responsibility for the consequences.
All content on Tim Bovee, Private Trader by Timothy K. Bovee is licensed under a Creative Commons Attribution-ShareAlike 4.0 International License.
Based on work at www.timbovee.com

You must be logged in to post a comment.