3:30 p.m. New York time
Half an hour before the closing bell. The S&P 500 futures fell sharply during the session, reaching a low of 6801.50 and then rising back into the 6870s and once again declining.
Elliott Wave Theory: The decline remains consistent with falling wave C{-10} within falling wave C{-9} within wave 4{-8}. All three remain downward unless price can reclaim and hold above the prior breakdown shelf (mid-to-upper 6860s) for more than a brief bounce.
9:35 a.m. New York time.
What’s happening now. The S&P 500 E-mini futures declined overnight, sliding from an early peak of 6935.25 down into the 6830s.
What does it mean? Elliott Wave Theory: The principal wave in play remains wave 4{-6}, the upward correction that began October 10, 2025 at 6540.25. Wave 4{-6} is taking the form of an expanding triangle, so each successive subwave makes a larger swing (higher highs and lower lows) as the structure matures.
Within that triangle, wave C{-7} (the third of five triangle legs) is still the active leg—but C{-7} is currently being dragged down by its internal correction, wave 4{-8}.
Zooming in:
- Wave 4{-8} is unfolding as a three-part decline, and is now in its final segment, wave C{-9}.
- Wave C{-9} is subdividing lower, and within it we are in wave C{-10} (the down-leg that followed the 2/3 peak at 7027.25). Your 30-minute chart continues to support this: A{-10} bottomed 2/1 at 6864.50, B{-10} peaked 2/3 at 7027.25, and price is now pressing lower in C{-10}.
Practical read / levels.
- The market is still acting like “B-wave churn turning into C-wave pressure.”
- 6864.50 (the 2/1 low) is the near-term line in the sand. A clean break and failure to reclaim it keeps C{-10} in control and opens the door toward the prior low near 6814.50 (1/21).
- A recovery back above 6935.25 would ease the immediate downside pressure, but the larger confirmation/invalidation remains unchanged: 7043 is still the key “B{-9} strength” level on your map.
This morning’s economics darta release was seasonally adjusted initial jobless claims, which rose to 231,000 (+22,000) and the 4-week average increased to 212,250; insured unemployment is 1.844M (+25,000) with the insured unemployment rate unchanged at 1.2%. Initial Jobless Claims 20250205 It’s not “crisis,” but it adds a small tailwind to risk-off tone in a week where other jobs data are disrupted.
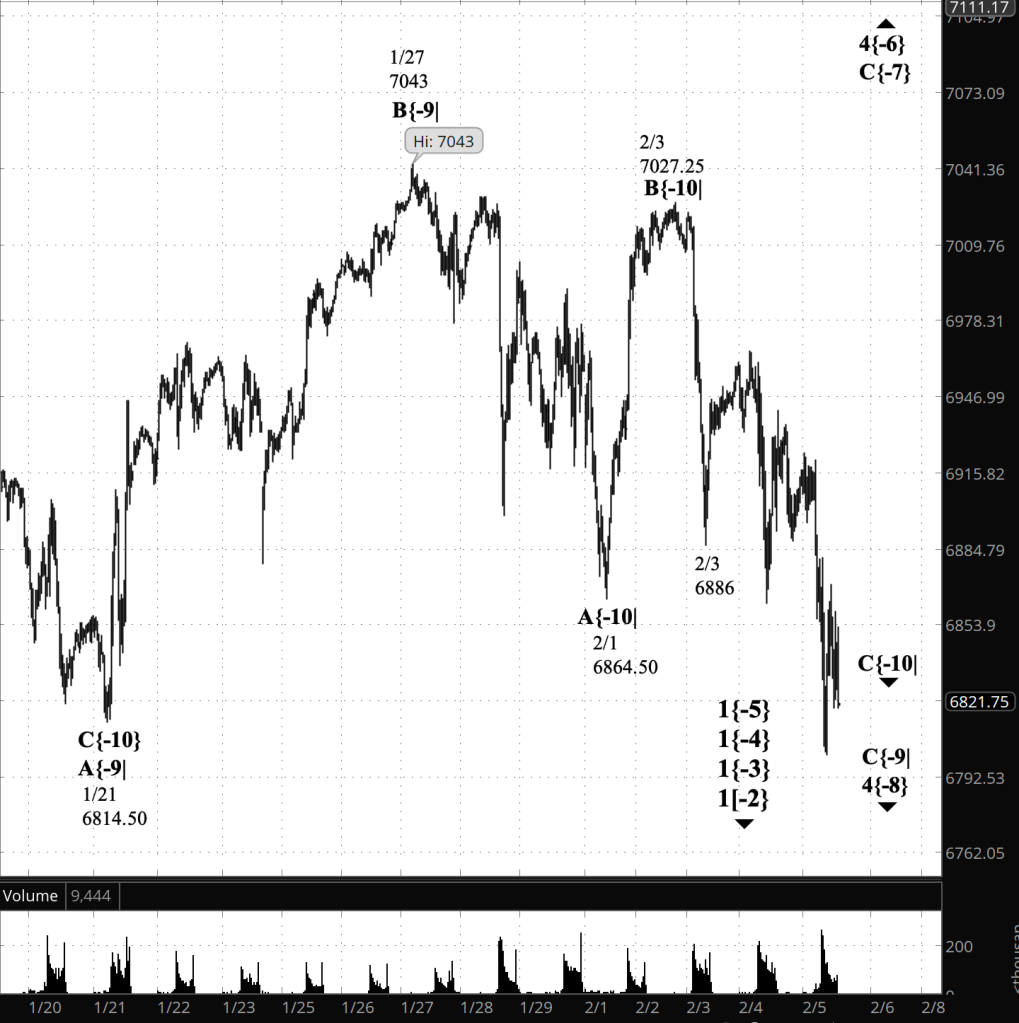
[S&P 500 E-mini futures at 3:30 p.m., 30-minute bars, with volume]
Waves Now Underway
These are the waves currently in progress under my principal analysis. Each line on the list shows the wave number, with the subscript in curly brackets, the traditional degree name, the starting date, the starting price of the S&P 500 E-mini futures, and the direction of the wave.
Most of the waves began not long ago, on October 8, 2025. See my essay posted on October 12, 2025, “The End of the Rise from 1932? Elliott Wave Theory Says ‘Yes’”, for a discussion of how that happened.
The difficult problem of estimating when a wave change should be accept as real rather than a headfake is addressed by the essay titled, “Is This Reversal Real?: How to Tell Without Being Whipsawed”.
- 1{+4} Supermillennium, (unknown start date or start price) {down}
- A hypothetical wave one degree higher than Supercyle, needed to make the wave analysis complete.
- S&P 500 Index:
- 1{+3} Supercycle, 10/8/2025, 6812.25 (down}
- 1{+2} Cycle, 10/8/2025, 6812.25 (down}
- 1{+1} Primary, 10/8/2025, 6812.25 (down}
- 1{0} Intermediate, 10/8/2025, 6812.25 (down}
- 1{-1} Minor, 10/8/2025, 6812.25 (down}
- 1{-2} Minute, 10/8/2025, 6812.25 (down}
- S&P 500 Futures
- 1{-3} Minuette 10/8/2025, 6812.25 (down}
- 1{-4} Subminutte 10/8/2025, 6812.25 (down}
- 1{-5} Micro, 10/8/2025, 6812.25 (down}
- 4{-6} Submicro, 10/10/2025, 6540.25 (up)
- C{-7} Minuscule, 11/21/2025, 6525 (up)
- 4{-8} (none), 1/13/2026, 7036.25 (down)
- C{-9} (none), 1/27/2026, 7043 (down)
Reading the chart. Price movements — waves – – in Elliott Wave Theory analysis are labeled with numbers within trending waves and letters with corrective waves. The subscripts — numbers in curly brackets — designate the wave’s degree, which, in Elliott Wave analysis, means the relative position of a wave within the larger and smaller structures that make up the chart. R.N. Elliott, who in the 1930s developed the form of analysis that bears his name, viewed the chart as a complex structure of smaller waves nested within larger waves, which in turn are nested within still larger waves. In mathematics it’s called a fractal structure, where at every scale the pattern is similar to the others.
Learning and other resources. Elliott Wave analysis provides context, not prophecy. As the 20th century semanticist Alfred Korzybski put it in his book Science and Sanity (1933), “The map is not the territory … The only usefulness of a map depends on similarity of structure between the empirical world and the map.” And I would add, in the ever-changing markets, we can judge that similarity of structure only after the fact.
See the menu page Analytical Methods for a rundown on where to go for information on Elliott Wave analysis.
By Tim Bovee, Portland, Oregon, February 5, 2026
Disclaimer
Tim Bovee, Private Trader tracks the analysis and trades of a private trader for his own accounts. Nothing in this blog constitutes a recommendation to buy or sell stocks, options or any other financial instrument. The only purpose of this blog is to provide education and entertainment.
No trader is ever 100 percent successful in his or her trades. Trading in the stock and option markets is risky and uncertain. Each trader must make trading decisions for his or her own account, and take responsibility for the consequences.
All content on Tim Bovee, Private Trader by Timothy K. Bovee is licensed under a Creative Commons Attribution-ShareAlike 4.0 International License.
Based on work at www.timbovee.com

You must be logged in to post a comment.