3:30 p.m. New York time
Half an hour before the closing bell. After the morning jobs data was released, the S&P 500 futures ended the drama of the day early in the session, after falling from 7011.50 to 6931. Thereafter, the price went on a slow climb, returning to the 6970s.
Elliott Wave Theory. Unchanged. Wave D{-11} continues to rise.
9:40 a.m. New York time.
What’s happening now. Half an hour before the opening bell, the S&P 500 E-mini futures jumped on the Employment Situation Report. January unemployment was at 4.3% (down 0.1% from the past month and up 0.3% from the past year). The price reacted in two stages—first a measured climb that took about 25 minutes to push into the 7000s, then a second push that carried into the 7010s as the cash open approached.
What does it mean? Through the lens of Elliott Wave Theory, this strengthens the working count that rising wave D{-11} is underway. D{-11} remains a countertrend rally inside falling wave C{-10}, which itself sits inside falling wave C{-9}, all within the larger corrective structure wave 4{-8}. In other words: today’s surge supports “D{-11} up” as a rally within a broader correction—not, by itself, a full trend reversal.
Here are the decision points. The first upside test is the 7027.25 pivot (2/3). A clean break and hold above it keeps D{-11} advancing and reopens the door to the larger confirmation level at 7043 (1/27). Below price, the first “give-back” level is the big round 7000 area; losing that shifts attention to the pre-ramp basing zone in the high 6960s–6970s, and then the morning low near 6953. A decisive rejection under 7027.25 followed by a breakdown back through those supports would fit the “D{-11) tops → C{-10} resumes down” pathway
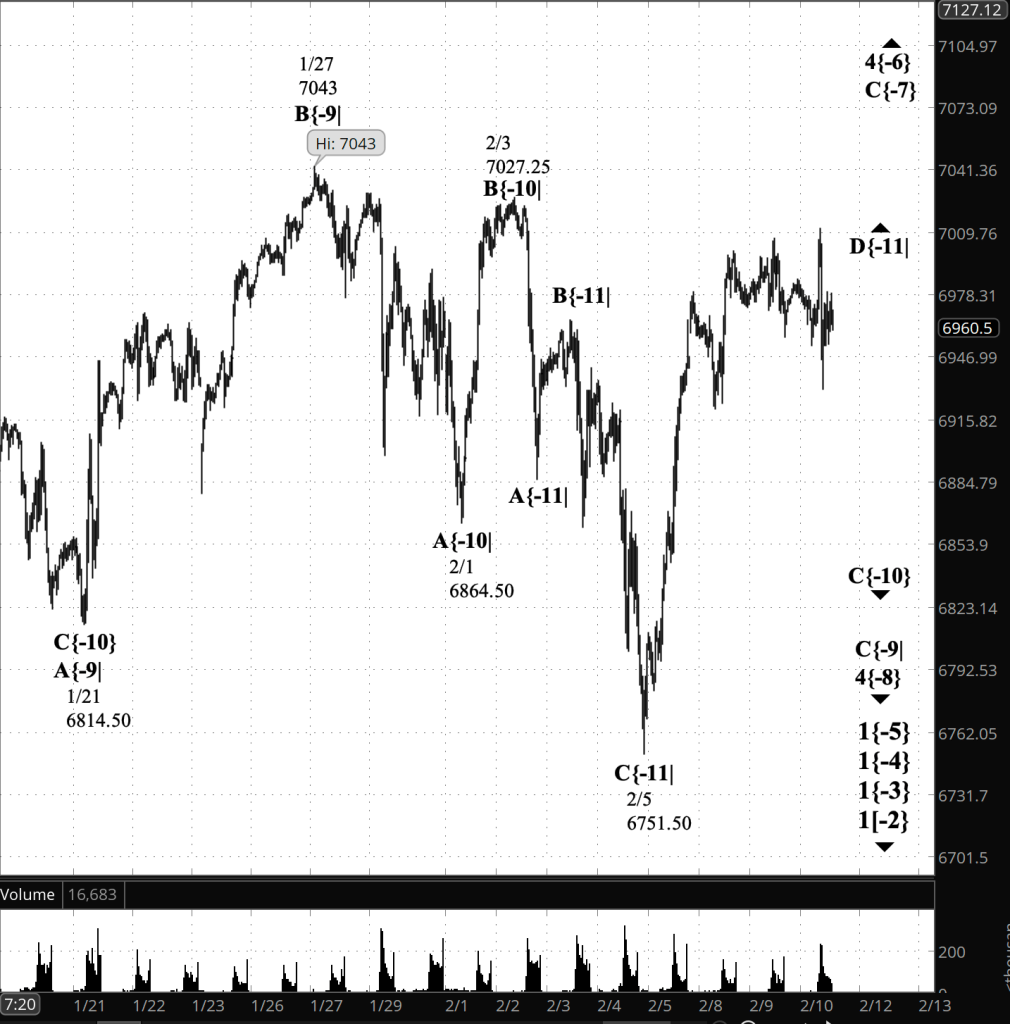
[S&P 500 E-mini futures at 3:30 p.m., 40-minute bars, with volume]
Waves Now Underway
These are the waves currently in progress under my principal analysis. Each line on the list shows the wave number, with the subscript in curly brackets, the traditional degree name, the starting date, the starting price of the S&P 500 E-mini futures, and the direction of the wave.
Most of the waves began not long ago, on October 8, 2025. See my essay posted on October 12, 2025, “The End of the Rise from 1932? Elliott Wave Theory Says ‘Yes’”, for a discussion of how that happened.
The difficult problem of estimating when a wave change should be accept as real rather than a headfake is addressed by the essay titled, “Is This Reversal Real?: How to Tell Without Being Whipsawed”.
- 1{+4} Supermillennium, (unknown start date or start price) {down}
- A hypothetical wave one degree higher than Supercyle, needed to make the wave analysis complete.
- S&P 500 Index:
- 1{+3} Supercycle, 10/8/2025, 6812.25 (down}
- 1{+2} Cycle, 10/8/2025, 6812.25 (down}
- 1{+1} Primary, 10/8/2025, 6812.25 (down}
- 1{0} Intermediate, 10/8/2025, 6812.25 (down}
- 1{-1} Minor, 10/8/2025, 6812.25 (down}
- 1{-2} Minute, 10/8/2025, 6812.25 (down}
- S&P 500 Futures
- 1{-3} Minuette 10/8/2025, 6812.25 (down}
- 1{-4} Subminutte 10/8/2025, 6812.25 (down}
- 1{-5} Micro, 10/8/2025, 6812.25 (down}
- 4{-6} Submicro, 10/10/2025, 6540.25 (up)
- C{-7} Minuscule, 11/21/2025, 6525 (up)
- 4{-8} (none), 1/13/2026, 7036.25 (down)
- C{-9} (none), 1/27/2026, 7043 (down)
- C{-10} (none), 2/3/2026, 7027.25 (down)
- D{-11} (none), 2/5/2026, 6751.50 (down)
Reading the chart. Price movements — waves – – in Elliott Wave Theory analysis are labeled with numbers within trending waves and letters with corrective waves. The subscripts — numbers in curly brackets — designate the wave’s degree, which, in Elliott Wave analysis, means the relative position of a wave within the larger and smaller structures that make up the chart. R.N. Elliott, who in the 1930s developed the form of analysis that bears his name, viewed the chart as a complex structure of smaller waves nested within larger waves, which in turn are nested within still larger waves. In mathematics it’s called a fractal structure, where at every scale the pattern is similar to the others.
Learning and other resources. Elliott Wave analysis provides context, not prophecy. As the 20th century semanticist Alfred Korzybski put it in his book Science and Sanity (1933), “The map is not the territory … The only usefulness of a map depends on similarity of structure between the empirical world and the map.” And I would add, in the ever-changing markets, we can judge that similarity of structure only after the fact.
See the menu page Analytical Methods for a rundown on where to go for information on Elliott Wave analysis.
By Tim Bovee, Portland, Oregon, February 11, 2026
Disclaimer
Tim Bovee, Private Trader tracks the analysis and trades of a private trader for his own accounts. Nothing in this blog constitutes a recommendation to buy or sell stocks, options or any other financial instrument. The only purpose of this blog is to provide education and entertainment.
No trader is ever 100 percent successful in his or her trades. Trading in the stock and option markets is risky and uncertain. Each trader must make trading decisions for his or her own account, and take responsibility for the consequences.
All content on Tim Bovee, Private Trader by Timothy K. Bovee is licensed under a Creative Commons Attribution-ShareAlike 4.0 International License.
Based on work at www.timbovee.com

You must be logged in to post a comment.