3:30 p.m. New York time
Half an hour before the closing bell. The S&P 500 futures continued to drift lower during the session, reaching the mid-6840s and pressing into the lower end of the morning’s decision zone.
Elliott Wave Theory: This price action remains consistent with a counter-trend decline within wave E{-11}, and no revision to the broader Elliott Wave interpretation is warranted at this time.
9:35 a.m. New York time.
What’s happening now? The S&P 500 E-mini futures rose slightly overnight, to 6912.50, and then fell sharply into the 6860s. The low point came shortly after release of economics reports, Initial Jobless Claims and U.S. International Trade in Goods and Services.
What does it mean? Elliott Wave Theory analysis sees the rise as a counter-trend correction within a larger decline, part of falling wave E{-11}. That E wave is part of a large dclining wave C{-10}, which in turn is part of a still larger deline, wave C{-9}.
The whole structure is part of declining wave 4{-8}, a downward correction that began on January 13 from 7036.25.
Decision points. Near-term downside reference (6860–6850 zone).
The overnight selloff carried the S&P 500 E-mini futures into the 6860s, with an intraday low near 6862 on the 5-minute chart. This zone now serves as the first decision point.
- Hold above 6850–6860: favors continued sideways-to-down consolidation within wave E{-11}, allowing for brief counter-trend rebounds.
- Sustained break below 6850: increases the odds that wave E{-11} is extending lower, opening the door to a test of the early-February lows.
Overhead resistance (6900–6915).
The overnight high at 6912.50 defines the nearest resistance band.
- Failure below 6915: keeps the decline intact and supports the interpretation of the overnight rise as a corrective bounce.
- Recovery and hold above 6915: would argue for a more complex correction, but would still be counter-trend unless followed by acceptance above 6950.
Structural invalidation level (6950–6970).
A sustained move back above the 6950–6970 region would begin to challenge the labeling of the decline as an active wave E{-11} within C{-10}.
- Until that occurs, the dominant bias remains lower within the broader wave 4{-8} correction.
Larger-degree context.
As long as price remains well below the January 27 high at 7043, the larger bearish structure — declining C{-9} within 4{-8} — remains intact. Any rallies should be treated as corrective unless proven otherwise by structure and follow-through.
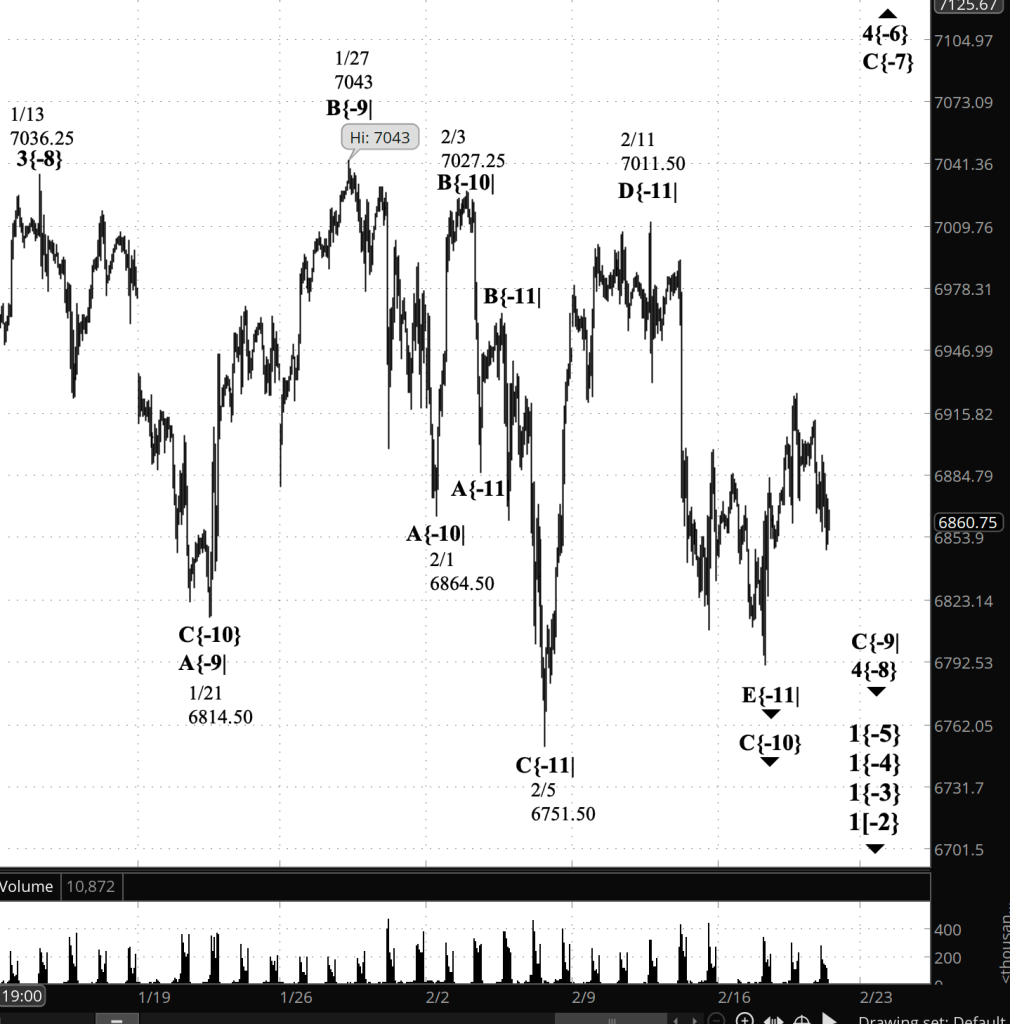
[S&P 500 E-mini futures at 3:30 p.m., 70-minute bars, with volume]
Waves Now Underway
These are the waves currently in progress under my principal analysis. Each line on the list shows the wave number, with the subscript in curly brackets, the traditional degree name, the starting date, the starting price of the S&P 500 E-mini futures, and the direction of the wave.
Most of the waves began not long ago, on October 8, 2025. See my essay posted on October 12, 2025, “The End of the Rise from 1932? Elliott Wave Theory Says ‘Yes’”, for a discussion of how that happened.
The difficult problem of estimating when a wave change should be accept as real rather than a headfake is addressed by the essay titled, “Is This Reversal Real?: How to Tell Without Being Whipsawed”.
- 1{+4} Supermillennium, (unknown start date or start price) {down}
- A hypothetical wave one degree higher than Supercyle, needed to make the wave analysis complete.
- S&P 500 Index:
- 1{+3} Supercycle, 10/8/2025, 6812.25 (down}
- 1{+2} Cycle, 10/8/2025, 6812.25 (down}
- 1{+1} Primary, 10/8/2025, 6812.25 (down}
- 1{0} Intermediate, 10/8/2025, 6812.25 (down}
- 1{-1} Minor, 10/8/2025, 6812.25 (down}
- 1{-2} Minute, 10/8/2025, 6812.25 (down}
- S&P 500 Futures
- 1{-3} Minuette 10/8/2025, 6812.25 (down}
- 1{-4} Subminutte 10/8/2025, 6812.25 (down}
- 1{-5} Micro, 10/8/2025, 6812.25 (down}
- 4{-6} Submicro, 10/10/2025, 6540.25 (up)
- C{-7} Minuscule, 11/21/2025, 6525 (up)
- 4{-8} (none), 1/13/2026, 7036.25 (down)
- C{-9} (none), 1/27/2026, 7043 (down)
- C{-10} (none), 2/3/2026, 7027.25 (down)
- E{-11} (none), 2/11/2026, 7011.50 (down)
Reading the chart. Price movements — waves – – in Elliott Wave Theory analysis are labeled with numbers within trending waves and letters with corrective waves. The subscripts — numbers in curly brackets — designate the wave’s degree, which, in Elliott Wave analysis, means the relative position of a wave within the larger and smaller structures that make up the chart. R.N. Elliott, who in the 1930s developed the form of analysis that bears his name, viewed the chart as a complex structure of smaller waves nested within larger waves, which in turn are nested within still larger waves. In mathematics it’s called a fractal structure, where at every scale the pattern is similar to the others.
Learning and other resources. Elliott Wave analysis provides context, not prophecy. As the 20th century semanticist Alfred Korzybski put it in his book Science and Sanity (1933), “The map is not the territory … The only usefulness of a map depends on similarity of structure between the empirical world and the map.” And I would add, in the ever-changing markets, we can judge that similarity of structure only after the fact.
See the menu page Analytical Methods for a rundown on where to go for information on Elliott Wave analysis.
By Tim Bovee, Portland, Oregon, February 19, 2026
Disclaimer
Tim Bovee, Private Trader tracks the analysis and trades of a private trader for his own accounts. Nothing in this blog constitutes a recommendation to buy or sell stocks, options or any other financial instrument. The only purpose of this blog is to provide education and entertainment.
No trader is ever 100 percent successful in his or her trades. Trading in the stock and option markets is risky and uncertain. Each trader must make trading decisions for his or her own account, and take responsibility for the consequences.
All content on Tim Bovee, Private Trader by Timothy K. Bovee is licensed under a Creative Commons Attribution-ShareAlike 4.0 International License.
Based on work at www.timbovee.com

You must be logged in to post a comment.