3:30 p.m. New York time
Half an hour before the closing bell. Today’s market was like a basketball in the hands of a very tall player.
First, two economic reports—the GDP production metric and the PCE price metric—came in worse than expected. Bam! The player slammed the ball to the court floor. That’s how prices fell.
A few hours later, the Supreme Court issued an opinion ruling against the legality of many tariffs imposed by President Trump during his current second term. The player grabbed the basketball on the bounce, aimed, and neatly slid it through the basket to score. That’s how prices rose after the Court’s ruling.
The S&P 500 futures reached a session low of 6847.25 in response to the GDP and PCE reports. As the Court released its decision a bit more than half an hour after the opening bell, prices rose rapidly into the 6920s, whipsawed energetically, and then reached a high of 6931.50, before settling back into the 6910s.
Elliott Wave Theory? No change. Wave E{-11} continues its downward march.
Decision points.
- 6900: Balance line. Continued overlap here favors consolidation within E{-11}.
- Below ~6875: Downside pressure likely resumes.
- Above ~6935 with follow-through: Would suggest E{-11} is ending and a counter-trend bounce is attempting to assert itself.
- Bias: Corrective volatility continues until price resolves away from the balance zone.
9:35 a.m. New York time.
What’s happening now? The S&P 500 E-mini futures peaked overight at 6904.75 and then began to fall, reaching into the 6840s after economic reports showed Gross Domestic Product increasing less than expected and Personal Consumption Expenditures increasing more than expected.
What does it mean? The decline leaves the current Elliott Wave Theory analysis unchanged. It describes a series of falling subwaves — E{-11} within C{-10] within C{-9} — within a downward correction, wave 4{-8}, that began on January 13.
Decision points.
• 6850–6845: Near-term support. Holding here keeps the decline consistent with an ongoing E{-11} subwave.
• Below ~6840: Increases the likelihood that E{-11} is extending, with risk shifting toward lower support within wave 4{-8}.
• Reclaim and hold above 6885: Suggests E{-11} may be ending, allowing for a counter-trend bounce inside the correction.
• Bias: Downside favored unless prior support is reclaimed with follow-through.
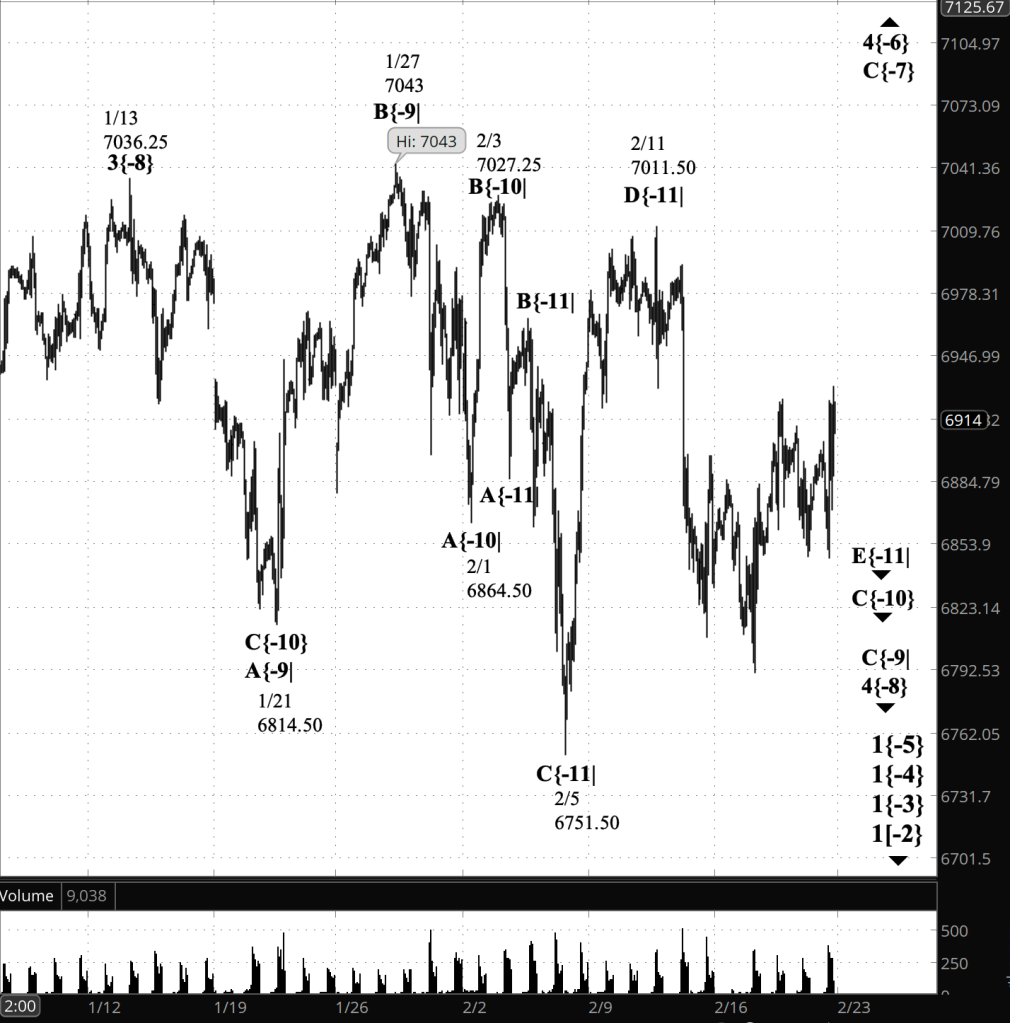
[S&P 500 E-mini futures at 3:30 p.m., 80-minute bars, with volume]
Waves Now Underway
These are the waves currently in progress under my principal analysis. Each line on the list shows the wave number, with the subscript in curly brackets, the traditional degree name, the starting date, the starting price of the S&P 500 E-mini futures, and the direction of the wave.
Most of the waves began not long ago, on October 8, 2025. See my essay posted on October 12, 2025, “The End of the Rise from 1932? Elliott Wave Theory Says ‘Yes’”, for a discussion of how that happened.
The difficult problem of estimating when a wave change should be accept as real rather than a headfake is addressed by the essay titled, “Is This Reversal Real?: How to Tell Without Being Whipsawed”.
- 1{+4} Supermillennium, (unknown start date or start price) {down}
- A hypothetical wave one degree higher than Supercyle, needed to make the wave analysis complete.
- S&P 500 Index:
- 1{+3} Supercycle, 10/8/2025, 6812.25 (down}
- 1{+2} Cycle, 10/8/2025, 6812.25 (down}
- 1{+1} Primary, 10/8/2025, 6812.25 (down}
- 1{0} Intermediate, 10/8/2025, 6812.25 (down}
- 1{-1} Minor, 10/8/2025, 6812.25 (down}
- 1{-2} Minute, 10/8/2025, 6812.25 (down}
- S&P 500 Futures
- 1{-3} Minuette 10/8/2025, 6812.25 (down}
- 1{-4} Subminutte 10/8/2025, 6812.25 (down}
- 1{-5} Micro, 10/8/2025, 6812.25 (down}
- 4{-6} Submicro, 10/10/2025, 6540.25 (up)
- C{-7} Minuscule, 11/21/2025, 6525 (up)
- 4{-8} (none), 1/13/2026, 7036.25 (down)
- C{-9} (none), 1/27/2026, 7043 (down)
- C{-10} (none), 2/3/2026, 7027.25 (down)
- E{-11} (none), 2/11/2026, 7011.50 (down)
Reading the chart. Price movements — waves – – in Elliott Wave Theory analysis are labeled with numbers within trending waves and letters with corrective waves. The subscripts — numbers in curly brackets — designate the wave’s degree, which, in Elliott Wave analysis, means the relative position of a wave within the larger and smaller structures that make up the chart. R.N. Elliott, who in the 1930s developed the form of analysis that bears his name, viewed the chart as a complex structure of smaller waves nested within larger waves, which in turn are nested within still larger waves. In mathematics it’s called a fractal structure, where at every scale the pattern is similar to the others.
Learning and other resources. Elliott Wave analysis provides context, not prophecy. As the 20th century semanticist Alfred Korzybski put it in his book Science and Sanity (1933), “The map is not the territory … The only usefulness of a map depends on similarity of structure between the empirical world and the map.” And I would add, in the ever-changing markets, we can judge that similarity of structure only after the fact.
See the menu page Analytical Methods for a rundown on where to go for information on Elliott Wave analysis.
By Tim Bovee, Portland, Oregon, February 20, 2026
Disclaimer
Tim Bovee, Private Trader tracks the analysis and trades of a private trader for his own accounts. Nothing in this blog constitutes a recommendation to buy or sell stocks, options or any other financial instrument. The only purpose of this blog is to provide education and entertainment.
No trader is ever 100 percent successful in his or her trades. Trading in the stock and option markets is risky and uncertain. Each trader must make trading decisions for his or her own account, and take responsibility for the consequences.
All content on Tim Bovee, Private Trader by Timothy K. Bovee is licensed under a Creative Commons Attribution-ShareAlike 4.0 International License.
Based on work at www.timbovee.com

You must be logged in to post a comment.