3:30 p.m. New York time
Half an hour before the closing bell. The S&P 500 futures hit a low point early in the session and then began to rise, picking up the pace as the consumer confidence data was released.
Elliott Wave Theory: The magnitude of the rise suggests that downtrending wave E{-11} may have ended. It is a subwave buried several degrees deep within a broader downward correction, wave 4{-8}. If E{-11} has indeed ended, that would also mark the completion of its parent wave C{-10}, and one degree higher, wave C{-9}. In turn, that would imply the end of wave 4{-8} and the beginning of uptrending wave 5{-8}, a potentially significant reversal.
That said, the end of E{-11} has not yet been confirmed. This remains a “maybe,” not a done deal. A key question within the analysis is this: If E{-11} has ended, what was the date and price of that end?
I have placed date and price labels on two possible candidates: February 17 at 6791, and today, February 24, at 6828.50. The earlier date appears to mark the end of a clear five-wave decline. The later date is distinguished by the energy of the subsequent rise, especially when compared with the more halting advance that followed the earlier low.
I personally lean toward the earlier date as the endpoint, if wave E{-11} has truly ended. A colleague favors the later date as the terminal point.
As always, the chart will sort this out, as it always does.This is one of the reasons Elliott Wave Theory is so much fun.
9:35 a.m. New York time.
What’s happening now? The S&P 500 E-mini futures rose overnight to 6875 and then fell back into the 6840s, continuing the decline that began late yesterday.
What does it mean? Viewed through the lens of Elliott Wave Theory, the chart indicates that the fourth-wave downward correction, wave 4{-8}, remains in progress. Internally, the structure continues to resolve as a nested corrective sequence: wave E{-11} within wave C{-10} within wave C{-9}.
This configuration is consistent with late-stage corrective behavior, characterized by overlapping price action and limited directional conviction.
Decision Points
By the AI ChatGPT-5.2
Acceptance above the overnight high (~6875)
→ increases odds that wave E{-11} is complete and wave 5{-8} is starting.
Sustained trade below the overnight low (~6840)
→ signals E{-11} extension; stand down.
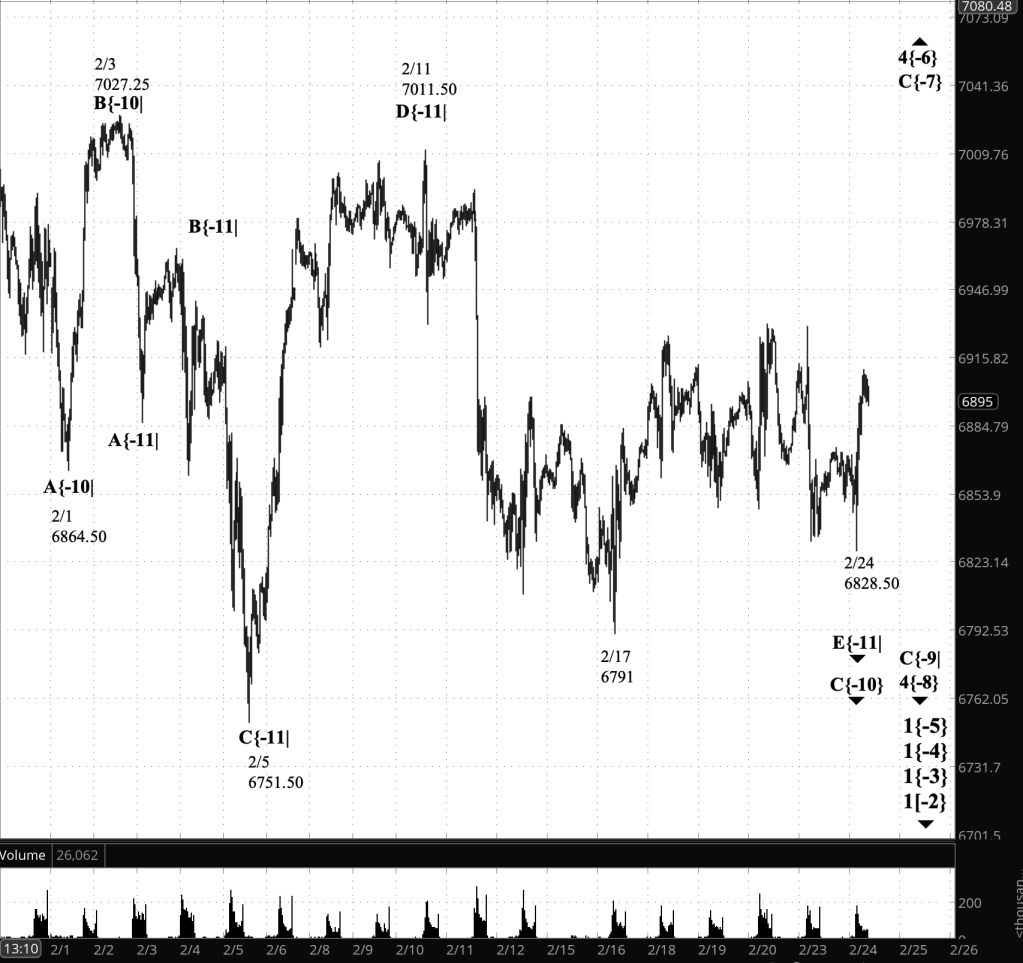
[S&P 500 E-mini futures at 3:30 pm., 35-minute bars, with volume]
Waves Now Underway
These are the waves currently in progress under my principal analysis. Each line on the list shows the wave number, with the subscript in curly brackets, the traditional degree name, the starting date, the starting price of the S&P 500 E-mini futures, and the direction of the wave.
Most of the waves began not long ago, on October 8, 2025. See my essay posted on October 12, 2025, “The End of the Rise from 1932? Elliott Wave Theory Says ‘Yes’”, for a discussion of how that happened.
The difficult problem of estimating when a wave change should be accept as real rather than a headfake is addressed by the essay titled, “Is This Reversal Real?: How to Tell Without Being Whipsawed”.
- 1{+4} Supermillennium, (unknown start date or start price) {down}
- A hypothetical wave one degree higher than Supercyle, needed to make the wave analysis complete.
- S&P 500 Index:
- 1{+3} Supercycle, 10/8/2025, 6812.25 (down}
- 1{+2} Cycle, 10/8/2025, 6812.25 (down}
- 1{+1} Primary, 10/8/2025, 6812.25 (down}
- 1{0} Intermediate, 10/8/2025, 6812.25 (down}
- 1{-1} Minor, 10/8/2025, 6812.25 (down}
- 1{-2} Minute, 10/8/2025, 6812.25 (down}
- S&P 500 Futures
- 1{-3} Minuette 10/8/2025, 6812.25 (down}
- 1{-4} Subminutte 10/8/2025, 6812.25 (down}
- 1{-5} Micro, 10/8/2025, 6812.25 (down}
- 4{-6} Submicro, 10/10/2025, 6540.25 (up)
- C{-7} Minuscule, 11/21/2025, 6525 (up)
- 4{-8} (none), 1/13/2026, 7036.25 (down)
- C{-9} (none), 1/27/2026, 7043 (down)
- C{-10} (none), 2/3/2026, 7027.25 (down)
- E{-11} (none), 2/11/2026, 7011.50 (down)
Reading the chart. Price movements — waves – – in Elliott Wave Theory analysis are labeled with numbers within trending waves and letters with corrective waves. The subscripts — numbers in curly brackets — designate the wave’s degree, which, in Elliott Wave analysis, means the relative position of a wave within the larger and smaller structures that make up the chart. R.N. Elliott, who in the 1930s developed the form of analysis that bears his name, viewed the chart as a complex structure of smaller waves nested within larger waves, which in turn are nested within still larger waves. In mathematics it’s called a fractal structure, where at every scale the pattern is similar to the others.
Learning and other resources. Elliott Wave analysis provides context, not prophecy. As the 20th century semanticist Alfred Korzybski put it in his book Science and Sanity (1933), “The map is not the territory … The only usefulness of a map depends on similarity of structure between the empirical world and the map.” And I would add, in the ever-changing markets, we can judge that similarity of structure only after the fact.
See the menu page Analytical Methods for a rundown on where to go for information on Elliott Wave analysis.
By Tim Bovee, Portland, Oregon, February 24, 2026
Disclaimer
Tim Bovee, Private Trader tracks the analysis and trades of a private trader for his own accounts. Nothing in this blog constitutes a recommendation to buy or sell stocks, options or any other financial instrument. The only purpose of this blog is to provide education and entertainment.
No trader is ever 100 percent successful in his or her trades. Trading in the stock and option markets is risky and uncertain. Each trader must make trading decisions for his or her own account, and take responsibility for the consequences.
All content on Tim Bovee, Private Trader by Timothy K. Bovee is licensed under a Creative Commons Attribution-ShareAlike 4.0 International License.
Based on work at www.timbovee.com

You must be logged in to post a comment.