3:30 p.m. New York time
Half an hour before the closing bell. The S&P 500 futures fell from its overnight peak, 6970.75, by 100 points, reaching 6870.75 during the session. As the session progressed, the futures partially recovered from the loss, rising into the 6920s.
Elliott Wave Theory: The rising 3rd subwave within uptrending wave 5{-8} continues.
9:35 a.m. New York time.
What’s happening now? The S&P 500 E-mini futures peaked at 6970.75 as overnight trading came to an end, and then fell sharply into the 6940s.
What does it mean? When Elliott Wave Theory analysis is applied, it is clear that uptrending wave 5{-8} continues. Which subwave is it in?
That’s problematic. The preceding rising wave, wave 3{-8}, lasted for only 11 days. When I take that fact into account, it seems likely that wave 5{-8} is in its 3rd subwave. If wave 5{-8} is of similar size to wave 3{-8}, and there is no guarantee that it will be, then it will end roughly around the 11th day since it began on February 17. That would be on February 28, more or less. Fifth waves are the most likely to truncate or extend, however, and it won’t be surprising if wave 5{-8} continues after that date, or ends before it, in either case by a large margin.
The uptrend remains intact as long as price holds above the February 17 low (6791); in the near term, a break back below the prior 2{-9} low area would argue that the current push is not the heart of 3{-9} and that 5{-8} is still basing.
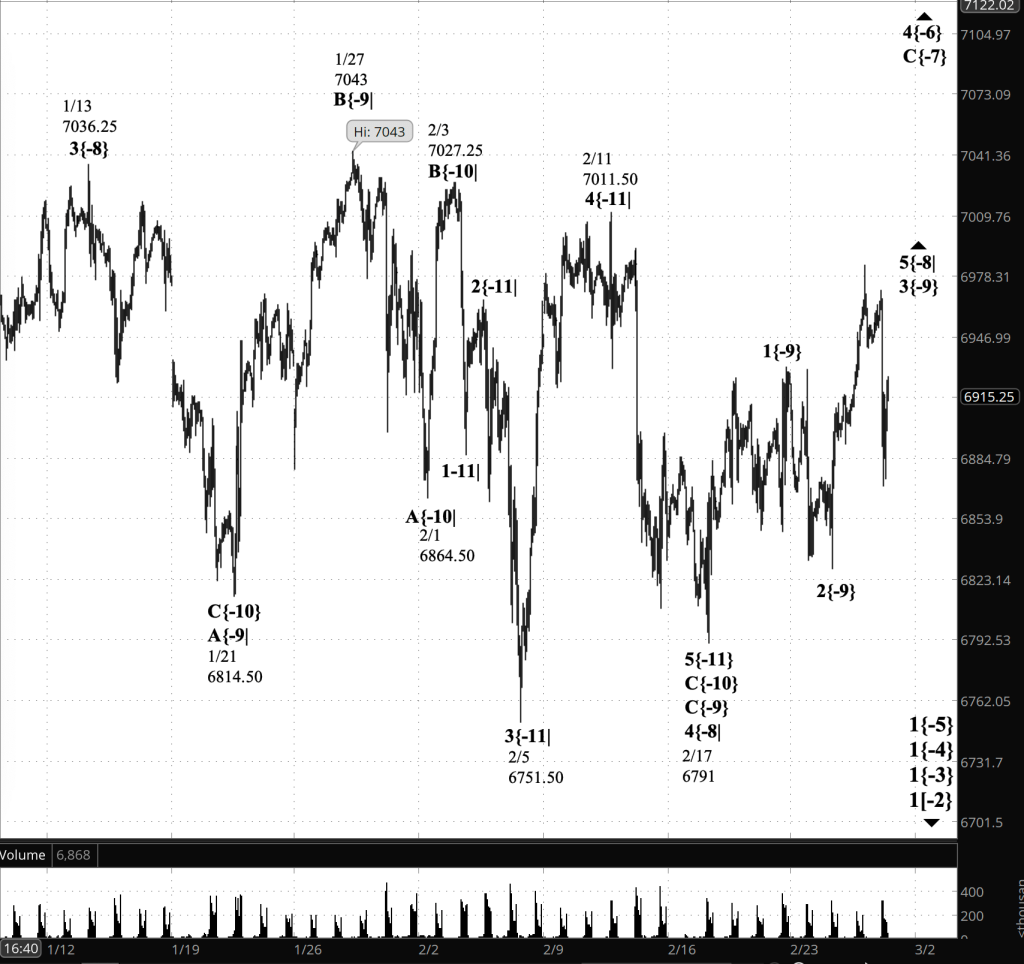
[S&P 500 E-mini futures at 3:30 p.m., 70-minute bars, with volume]
Waves Now Underway
These are the waves currently in progress under my principal analysis. Each line on the list shows the wave number, with the subscript in curly brackets, the traditional degree name, the starting date, the starting price of the S&P 500 E-mini futures, and the direction of the wave.
Most of the waves began not long ago, on October 8, 2025. See my essay posted on October 12, 2025, “The End of the Rise from 1932? Elliott Wave Theory Says ‘Yes’”, for a discussion of how that happened.
The difficult problem of estimating when a wave change should be accept as real rather than a headfake is addressed by the essay titled, “Is This Reversal Real?: How to Tell Without Being Whipsawed”.
- 1{+4} Supermillennium, (unknown start date or start price) {down}
- A hypothetical wave one degree higher than Supercyle, needed to make the wave analysis complete.
- S&P 500 Index:
- 1{+3} Supercycle, 10/8/2025, 6812.25 (down}
- 1{+2} Cycle, 10/8/2025, 6812.25 (down}
- 1{+1} Primary, 10/8/2025, 6812.25 (down}
- 1{0} Intermediate, 10/8/2025, 6812.25 (down}
- 1{-1} Minor, 10/8/2025, 6812.25 (down}
- 1{-2} Minute, 10/8/2025, 6812.25 (down}
- S&P 500 Futures
- 1{-3} Minuette 10/8/2025, 6812.25 (down}
- 1{-4} Subminutte 10/8/2025, 6812.25 (down}
- 1{-5} Micro, 10/8/2025, 6812.25 (down}
- 4{-6} Submicro, 10/10/2025, 6540.25 (up)
- C{-7} Minuscule, 11/21/2025, 6525 (up)
- 5{-8} (none), 2/17/2026, 6791 (up)
- 1{-9} (none), 2/17/2026, 6791 (up)
Reading the chart. Price movements — waves – – in Elliott Wave Theory analysis are labeled with numbers within trending waves and letters with corrective waves. The subscripts — numbers in curly brackets — designate the wave’s degree, which, in Elliott Wave analysis, means the relative position of a wave within the larger and smaller structures that make up the chart. R.N. Elliott, who in the 1930s developed the form of analysis that bears his name, viewed the chart as a complex structure of smaller waves nested within larger waves, which in turn are nested within still larger waves. In mathematics it’s called a fractal structure, where at every scale the pattern is similar to the others.
Learning and other resources. Elliott Wave analysis provides context, not prophecy. As the 20th century semanticist Alfred Korzybski put it in his book Science and Sanity (1933), “The map is not the territory … The only usefulness of a map depends on similarity of structure between the empirical world and the map.” And I would add, in the ever-changing markets, we can judge that similarity of structure only after the fact.
See the menu page Analytical Methods for a rundown on where to go for information on Elliott Wave analysis.
By Tim Bovee, Portland, Oregon, February 26, 2026
Disclaimer
Tim Bovee, Private Trader tracks the analysis and trades of a private trader for his own accounts. Nothing in this blog constitutes a recommendation to buy or sell stocks, options or any other financial instrument. The only purpose of this blog is to provide education and entertainment.
No trader is ever 100 percent successful in his or her trades. Trading in the stock and option markets is risky and uncertain. Each trader must make trading decisions for his or her own account, and take responsibility for the consequences.
All content on Tim Bovee, Private Trader by Timothy K. Bovee is licensed under a Creative Commons Attribution-ShareAlike 4.0 International License.
Based on work at www.timbovee.com

You must be logged in to post a comment.