3:30 p.m. New York time
Half an hour before the closing bell. .The S&P 500 futures hit its low early in the session at 6715.75 and then rose, repeatedly testing the 6770s, unable to rise to 6781 or higher.
Elliott Wave Theory. The stall below 6781 favors the present analysis, that declining wave B{-8} continues. Recall that this morning’s decision-points discussion said, “a recovery above the 6785–6800 range, where the post-report decline began, would signal that the downward leg of wave B{-8} may be complete.” That strong break into the 6780s and 6790s hasn’t happened, and while the continuation of wave B{-8} has not yet been confirmed, an ongoing B wave remains the status quo.
Looking forward on Decision Points. A move above 6785–6800 would argue that wave B{-8} has ended, while a renewed decline toward 6715 or lower would suggest that B{-8} continues to extend.
9:35 a.m. New York time.
What’s happening now. The S&P 500 E-mini futures fell overnight, picking up the pace when the Employment Situation Report was released an hour before the opening bell. The price responded by declining from 6799 to 6738.25 within the span of 30 minutes, and then slowed the pace as it drifted lower, still in the 6730s.
What does it mean? When Elliott Wave Theory is applied, the decline that followed the employment report appears to be a continuation of wave B{-8}, a downward corrective wave within rising wave 4{-7}.
Wave B corrections are often volatile and can extend further than expected before reversing. The present decline therefore may test the March 3 low near 6718.75 before the correction completes.
When wave B{-8} ends, it should be followed by an upward wave C{-8}, likely completing the larger wave 4{-7} correction.
Decision Points. If the decline continues, the first significant support lies at the March 3 low of 6718.75. A decisive break below that level would suggest that wave B{-8} is extending and could open the way toward the 6700 area before the correction ends. On the upside, a recovery above the 6785–6800 range, where the post-report decline began, would signal that the downward leg of wave B{-8} may be complete and that the market is beginning the upward wave C{-8} within the larger corrective wave 4{-7}.
How low can wave B{-8} go? Wave B corrections are often unpredictable and can extend further than expected before reversing. In the present case, the decline following the February 25 peak appears to be the C-leg of wave B{-8} within the larger corrective wave 4{-7}. A useful guideline in such structures is that the final leg of the correction frequently approaches — but does not greatly exceed — the low of the first decline in the sequence. That first decline ended at 6758.50 on March 2, and the subsequent downward leg has already moved below that level, reaching 6738.25 after the employment report. That modest overshoot suggests the correction may be nearing completion. If the decline extends further, the next logical area of support lies near the March 3 low at 6718.75, with the 6700 area marking a deeper but still plausible termination zone for wave B{-8}. A decisive break much below that region would weaken the interpretation that the present decline is part of a corrective structure and raise the possibility that a larger downward impulse is underway.
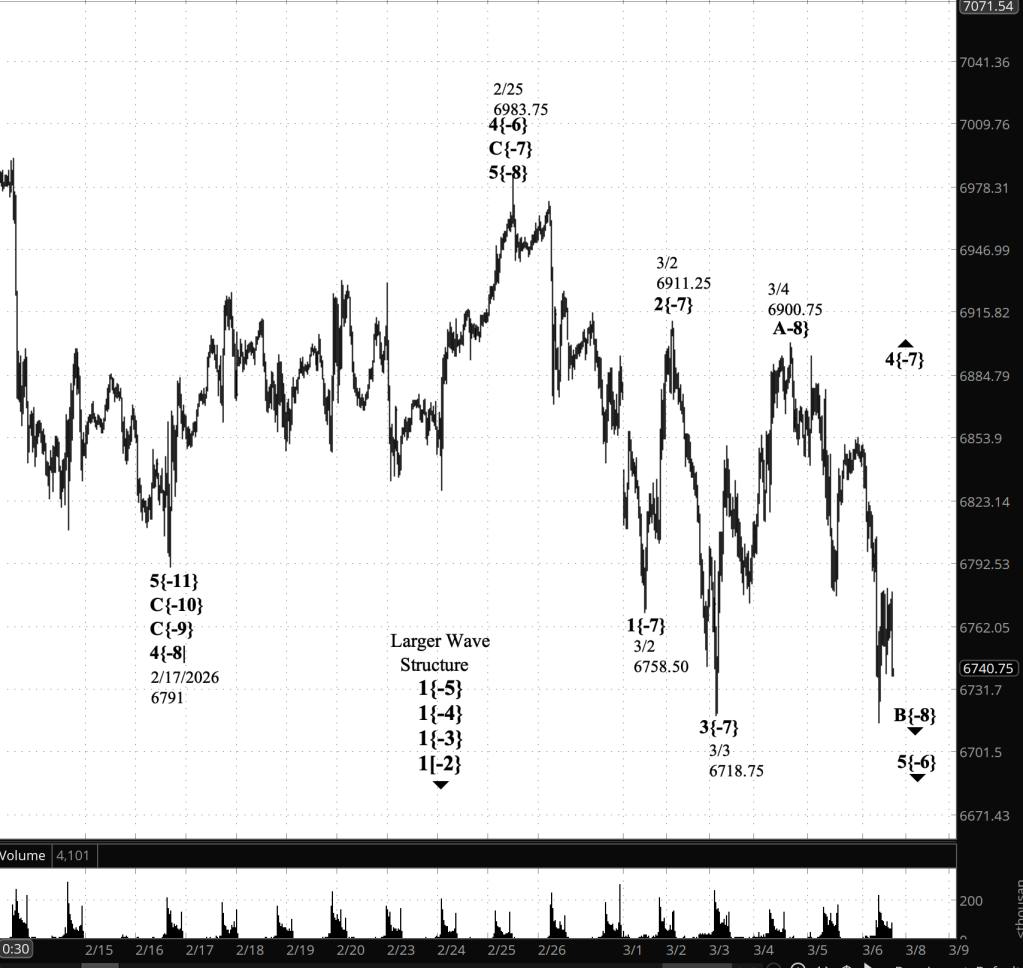
[S&P 500 E-mini futures at 3:30 p.m., 30-minute bars, with volume]
Waves Now Underway
These are the waves currently in progress under my principal analysis. Each line on the list shows the wave number, with the subscript in curly brackets, the traditional degree name, the starting date, the starting price of the S&P 500 E-mini futures, and the direction of the wave.
- 1{+4} Supermillennium, (unknown start date or start price) {down}
- A hypothetical wave one degree higher than Supercyle, needed to make the wave analysis complete.
- S&P 500 Index:
- 1{+3} Supercycle, 10/8/2025, 6812.25 (down}
- 1{+2} Cycle, 10/8/2025, 6812.25 (down}
- 1{+1} Primary, 10/8/2025, 6812.25 (down}
- 1{0} Intermediate, 10/8/2025, 6812.25 (down}
- 1{-1} Minor, 10/8/2025, 6812.25 (down}
- 1{-2} Minute, 10/8/2025, 6812.25 (down}
- S&P 500 Futures
- 1{-3} Minuette 10/8/2025, 6812.25 (down}
- 1{-4} Subminutte 10/8/2025, 6812.25 (down}
- 1{-5} Micro, 10/8/2025, 6812.25 (down}
- 5{-6} Submicro, 2/25/2026, 6983.75 (down)
- 4{-7} Minuscule, 3/3/2026, 6718.75 (up)
- B{-8} (none), 3/4/2026, 6900.75 (down)
Reading the chart. Price movements — waves – – in Elliott Wave Theory analysis are labeled with numbers within trending waves and letters with corrective waves. The subscripts — numbers in curly brackets — designate the wave’s degree, which, in Elliott Wave analysis, means the relative position of a wave within the larger and smaller structures that make up the chart. R.N. Elliott, who in the 1930s developed the form of analysis that bears his name, viewed the chart as a complex structure of smaller waves nested within larger waves, which in turn are nested within still larger waves. In mathematics it’s called a fractal structure, where at every scale the pattern is similar to the others.
Learning and other resources. Elliott Wave analysis provides context, not prophecy. As the 20th century semanticist Alfred Korzybski put it in his book Science and Sanity (1933), “The map is not the territory … The only usefulness of a map depends on similarity of structure between the empirical world and the map.” And I would add, in the ever-changing markets, we can judge that similarity of structure only after the fact.
See the menu page Analytical Methods for a rundown on where to go for information on Elliott Wave analysis.
By Tim Bovee, Portland, Oregon, March 6, 2026
Disclaimer
Tim Bovee, Private Trader tracks the analysis and trades of a private trader for his own accounts. Nothing in this blog constitutes a recommendation to buy or sell stocks, options or any other financial instrument. The only purpose of this blog is to provide education and entertainment.
No trader is ever 100 percent successful in his or her trades. Trading in the stock and option markets is risky and uncertain. Each trader must make trading decisions for his or her own account, and take responsibility for the consequences.
All content on Tim Bovee, Private Trader by Timothy K. Bovee is licensed under a Creative Commons Attribution-ShareAlike 4.0 International License.
Based on work at www.timbovee.com
