3:30 p.m. New York time
Half an hour before the closing bell. After a steep fall from the overnight high of 6814, the S&P 500 futures declined into the 6690s. When the Federal Open Market Committee later announced that it was holding interest rates steady, the price reaction was muted.
Elliott Wave Theory: The day’s movement strengthens the scenario that declining wave B{-6}, the middle subwave within the upward correction wave 2{-5}, is underway.
9:35 a.m. New York time
What’s happening now? The S&P 500 E-mini futures rose to an overnight high of 6814 and then fell sharply into the 6730s after the release of the Producer Price Index, which showed a 0.7% rise in February, the largest monthly increase since August 2023. The Federal Open Market Committee will publish its interest-rate decision at 2 p.m. New York time. The price rose slightly as the opening bell sounded.
What does it mean? Elliott Wave Theory analysis supports the view that rising wave A{-6} ended at the overnight high and that falling wave B{-6} began there.
Wave B{-6} is the middle subwave of wave 2{-5}, an upward correction that began on March 13. Like all B waves, it will subdivide into three waves.
The sharp decline following the PPI release increases confidence that declining wave B{-6} has begun. However, because the move was news-driven and the Federal Reserve decision later today remains a dominant catalyst, this interpretation should still be treated as provisional pending confirmation through continued failure to reclaim the recent high.
Decision Points
A continued failure below the 6810 area would support the view that wave A{-6} ended there and that declining wave B{-6} is underway.
A break below the morning low near 6741 would strengthen the bearish near-term case and suggest that B{-6} is extending downward.
A sustained rebound back above 6810 would weaken the B{-6} count and require reconsideration of whether wave A{-6} is still incomplete or the correction is taking a more complex form.
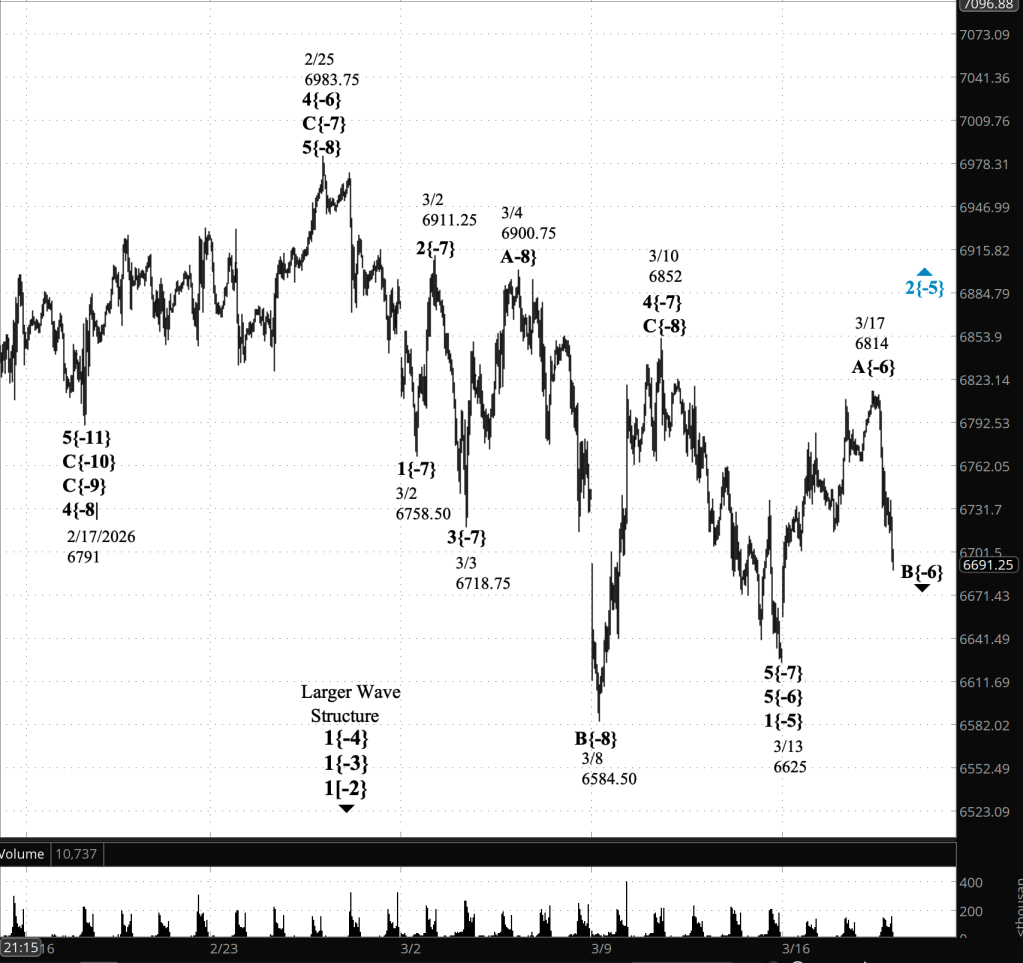
[S&P 500 E-mini futures at 3:30 p.m., 45-minute bars, with volume]
Waves Now Underway
These are the waves currently in progress under my principal analysis. Each line on the list shows the wave number, with the subscript in curly brackets, the traditional degree name, the starting date, the starting price of the S&P 500 E-mini futures, and the direction of the wave.
- 1{+4} Supermillennium, (unknown start date or start price) {down}
- A hypothetical wave one degree higher than Supercyle, needed to make the wave analysis complete.
- S&P 500 Index:
- 1{+3} Supercycle, 10/8/2025, 6812.25 (down}
- 1{+2} Cycle, 10/8/2025, 6812.25 (down}
- 1{+1} Primary, 10/8/2025, 6812.25 (down}
- 1{0} Intermediate, 10/8/2025, 6812.25 (down}
- 1{-1} Minor, 10/8/2025, 6812.25 (down}
- 1{-2} Minute, 10/8/2025, 6812.25 (down}
- S&P 500 Futures
- 1{-3} Minuette 10/8/2025, 6812.25 (down}
- 1{-4} Subminutte 10/8/2025, 6812.25 (down}
- 2{-5} Micro, 3/13/2026, 6625 (up}
- B{-6} Submicro, 3/17/2026, 6814 (down}
Reading the chart. Price movements — waves – – in Elliott Wave Theory analysis are labeled with numbers within trending waves and letters with corrective waves. The subscripts — numbers in curly brackets — designate the wave’s degree, which, in Elliott Wave analysis, means the relative position of a wave within the larger and smaller structures that make up the chart. R.N. Elliott, who in the 1930s developed the form of analysis that bears his name, viewed the chart as a complex structure of smaller waves nested within larger waves, which in turn are nested within still larger waves. In mathematics it’s called a fractal structure, where at every scale the pattern is similar to the others.
Learning and other resources. Elliott Wave analysis provides context, not prophecy. As the 20th century semanticist Alfred Korzybski put it in his book Science and Sanity (1933), “The map is not the territory … The only usefulness of a map depends on similarity of structure between the empirical world and the map.” And I would add, in the ever-changing markets, we can judge that similarity of structure only after the fact.
See the menu page Analytical Methods for a rundown on where to go for information on Elliott Wave analysis.
By Tim Bovee, Portland, Oregon, March 18, 2026
Disclaimer
Tim Bovee, Private Trader tracks the analysis and trades of a private trader for his own accounts. Nothing in this blog constitutes a recommendation to buy or sell stocks, options or any other financial instrument. The only purpose of this blog is to provide education and entertainment.
No trader is ever 100 percent successful in his or her trades. Trading in the stock and option markets is risky and uncertain. Each trader must make trading decisions for his or her own account, and take responsibility for the consequences.
All content on Tim Bovee, Private Trader by Timothy K. Bovee is licensed under a Creative Commons Attribution-ShareAlike 4.0 International License.
Based on work at www.timbovee.com

You must be logged in to post a comment.