3:30 p.m. New York time
Half an hour before the closing bell. The S&P 500 futures traded within a relatively narrow range during much of the session, fluctuating between the 6650s and the 6610s, and then rapidlu rose in into the 6690s as the closing bell approached.
Elliott Wave Theory: Downtrending wave 3{-5} continues.
9:35 a.m. New York time
What’s happening now? The S&P 500 E-mini futures fell overnight to the 6610s and continued the decline.
What does it mean? Elliott Wave Theory analysis has rules that cannot be broken. When a rule is broken, the chart no longer matches reality — the map no longer matches the territory and must be redrawn.
The new map: Rising corrective wave 2{-5} ended on March 17 at 6814. Downtrending wave 3{-5} is now underway. The break below 6625 invalidated the prior wave B{-6} interpretation and confirms that the larger downtrend has resumed.
An alternative interpretation would label wave 2{-5} as taking the form of an expanding flat. The wave-3 scenario is the more straightforward reading of the price action and is therefore the principal analysis.
Early wave-3 environments often produce persistent downward pressure with only brief, overlapping rallies. A sustained break below 6623 would signal continuation toward lower support zones, while a recovery above the mid-to-upper 6600s would suggest the decline is pausing to subdivide before the larger trend resumes.
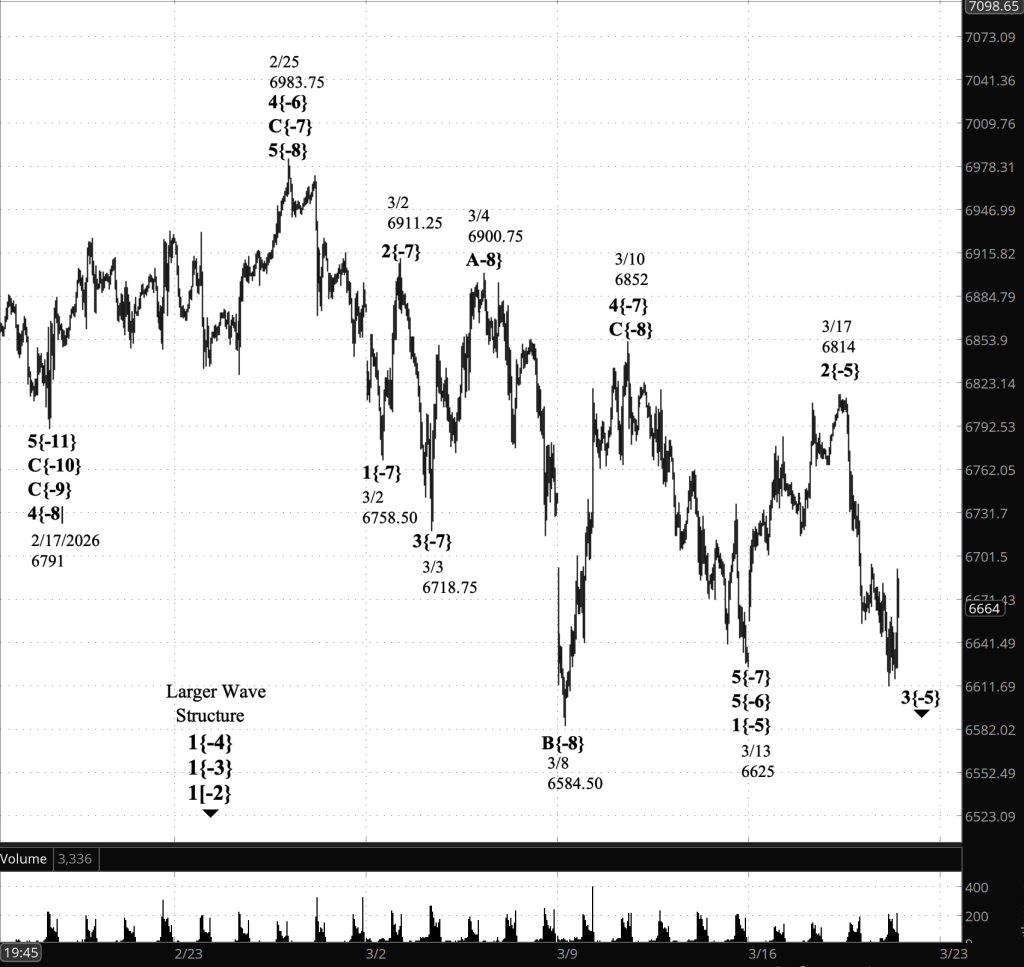
[S&P 500 E-mini futures at 3:30 p.m., 45-minute bars, with volume]
Waves Now Underway
These are the waves currently in progress under my principal analysis. Each line on the list shows the wave number, with the subscript in curly brackets, the traditional degree name, the starting date, the starting price of the S&P 500 E-mini futures, and the direction of the wave.
- 1{+4} Supermillennium, (unknown start date or start price) {down}
- A hypothetical wave one degree higher than Supercyle, needed to make the wave analysis complete.
- S&P 500 Index:
- 1{+3} Supercycle, 10/8/2025, 6812.25 (down}
- 1{+2} Cycle, 10/8/2025, 6812.25 (down}
- 1{+1} Primary, 10/8/2025, 6812.25 (down}
- 1{0} Intermediate, 10/8/2025, 6812.25 (down}
- 1{-1} Minor, 10/8/2025, 6812.25 (down}
- 1{-2} Minute, 10/8/2025, 6812.25 (down}
- S&P 500 Futures
- 1{-3} Minuette 10/8/2025, 6812.25 (down}
- 1{-4} Subminutte 10/8/2025, 6812.25 (down}
- 3{-5} Micro, 3/17/2026, 6814 (down}
Reading the chart. Price movements — waves – – in Elliott Wave Theory analysis are labeled with numbers within trending waves and letters with corrective waves. The subscripts — numbers in curly brackets — designate the wave’s degree, which, in Elliott Wave analysis, means the relative position of a wave within the larger and smaller structures that make up the chart. R.N. Elliott, who in the 1930s developed the form of analysis that bears his name, viewed the chart as a complex structure of smaller waves nested within larger waves, which in turn are nested within still larger waves. In mathematics it’s called a fractal structure, where at every scale the pattern is similar to the others.
Learning and other resources. Elliott Wave analysis provides context, not prophecy. As the 20th century semanticist Alfred Korzybski put it in his book Science and Sanity (1933), “The map is not the territory … The only usefulness of a map depends on similarity of structure between the empirical world and the map.” And I would add, in the ever-changing markets, we can judge that similarity of structure only after the fact.
See the menu page Analytical Methods for a rundown on where to go for information on Elliott Wave analysis.
By Tim Bovee, Portland, Oregon, March 19, 2026
Disclaimer
Tim Bovee, Private Trader tracks the analysis and trades of a private trader for his own accounts. Nothing in this blog constitutes a recommendation to buy or sell stocks, options or any other financial instrument. The only purpose of this blog is to provide education and entertainment.
No trader is ever 100 percent successful in his or her trades. Trading in the stock and option markets is risky and uncertain. Each trader must make trading decisions for his or her own account, and take responsibility for the consequences.
All content on Tim Bovee, Private Trader by Timothy K. Bovee is licensed under a Creative Commons Attribution-ShareAlike 4.0 International License.
Based on work at www.timbovee.com

You must be logged in to post a comment.