3:30 p.m. New York time
Half an hour before the closing bell. The S&P 500 futures continued to fall during the session, breaking below the previous low reached in the decline that began on January 27 from 7043.
Elliott Wave Theory. The move below the March 8 low indicates that the downward leg at the next lower degree remains incomplete. Falling wave A{-6} is therefore still underway, and the anticipated corrective rebound in rising wave B{-6} has not yet begun. The wave labeling has been revised to reflect this continued extension of the decline.
This interpretation remains consistent with the broader view that the market has been developing a large corrective pattern since late October 2025, likely wave 4{-4} taking the form of an expanding triangle. Under this framework, the ongoing weakness represents the continuation of wave C{-5} within that larger structure.
As always, the wave count will be refined as price action provides further confirmation.
Decision Points: Further decline below today’s session low would confirm that falling wave A{-6} is still extending and that the corrective rebound in wave B{-6} has not yet begun.
A recovery above the most recent internal swing high would be the first indication that wave A{-6} may be complete and that wave B{-6} is underway.
A sustained move that develops clear impulsive upward structure rather than overlapping swings would strengthen the case that the market is transitioning into the next corrective phase within the larger expanding-triangle framework.
9:35 a.m. New York time
What’s happening now? The S&P 500 E-mini futures fell overnight, so far reaching a low of 6607.75.
What does it mean? Recent price behavior has prompted an Elliott Wave Theory reassessment of the larger structure unfolding since late October 2025.
The market’s action during this period has been characterized by persistent overlap, widening price swings, and repeated failures of directional follow-through. These features are not typical of an advancing impulsive trend at the {-4} degree. Instead, they are more consistent with a large corrective phase.
Under the revised interpretation, the advance into October 29, 2025 is treated as the completion of wave 3{-4}. The movement since then is viewed as wave 4{-4}, likely developing as an expanding triangle. This pattern is consistent with the broadening volatility and unstable directional character that have dominated trading in recent months.
Within this structure, the decline into November 21, 2025 is labeled wave A{-5}, while the complex advance culminating on January 27, 2026 is labeled wave B{-5}. The market’s action since late January is treated as wave C{-5}, which remains in progress.
The initial phase of this decline appears to have ended on March 8 at 6584.50, marking the completion of wave A{-6}. Price behavior since that date is interpreted as the development of wave B{-6}, a corrective advance that may still be unfolding. The choppy, overlapping swings seen in recent sessions are consistent with the internal complexity typically associated with B-waves at this degree.
If this interpretation is correct, further sideways volatility or rally attempts remain possible before a final downward leg — wave C{-6} — completes the larger wave C{-5} decline. Such a sequence would remain consistent with the expanding triangle framework and would preserve proportionality across the wave hierarchy.
This revised structure better reflects the broadening nature of recent trading while allowing for continued sharp rallies and declines within the ongoing corrective phase. As always, the wave count will be refined as price action provides additional confirmation.
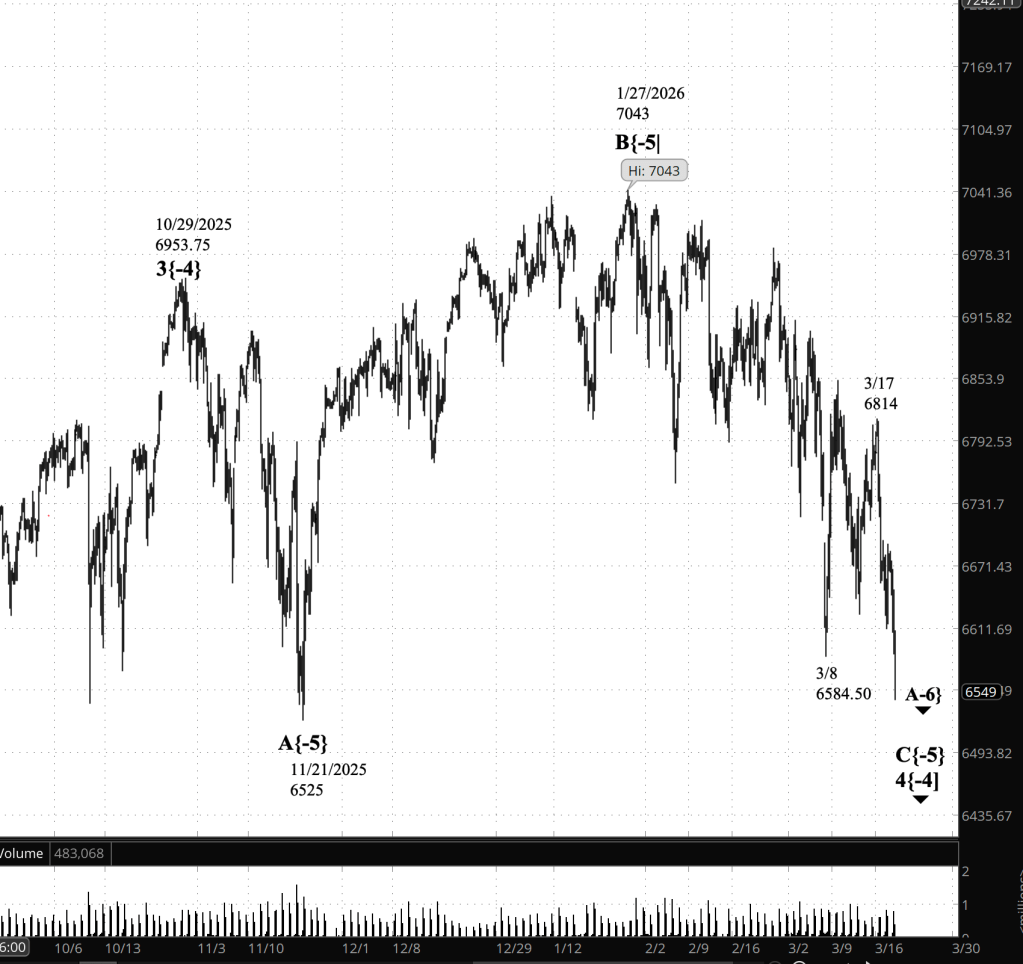
[S&P 500 E-mini futures at 3:30 p.m., 4-hour bars with volume]
Waves Now Underway
These are the waves currently in progress under my principal analysis. Each line on the list shows the wave number, with the subscript in curly brackets, the traditional degree name, the starting date, the starting price of the S&P 500 E-mini futures, and the direction of the wave.
- S&P 500 Index:
- 5{+3} Supercycle, 7/8/1932, 4.40 (up)
- 5{+2} Cycle, 12/9/1974, 60.96 (up)
- 5{+1} Primary, 3/6/2009, 666.79 (up)
- 5{0} Intermediate, 2/11/2016, 1810.10 (up)
- 3{-1} Minor, 3/23/2020, 2191.36 (up)
- 1{-2} Minute, 7/31/2025, 6468.50 (down)
- S&P 500 E-mini futures
- 5{-3} Minuette 8/1/2025, 6239.50 (up}
- 4{-4} Subminutte 10/29/2025, 6953.75 (down}
- C{-5} Micro, 1/27/2026, 7043 (down}
- A{-6} (none), 1/27/2026, 7043 (down}
Reading the chart. Price movements — waves – – in Elliott Wave Theory analysis are labeled with numbers within trending waves and letters with corrective waves. The subscripts — numbers in curly brackets — designate the wave’s degree, which, in Elliott Wave analysis, means the relative position of a wave within the larger and smaller structures that make up the chart. R.N. Elliott, who in the 1930s developed the form of analysis that bears his name, viewed the chart as a complex structure of smaller waves nested within larger waves, which in turn are nested within still larger waves. In mathematics it’s called a fractal structure, where at every scale the pattern is similar to the others.
Learning and other resources. Elliott Wave analysis provides context, not prophecy. As the 20th century semanticist Alfred Korzybski put it in his book Science and Sanity (1933), “The map is not the territory … The only usefulness of a map depends on similarity of structure between the empirical world and the map.” And I would add, in the ever-changing markets, we can judge that similarity of structure only after the fact.
See the menu page Analytical Methods for a rundown on where to go for information on Elliott Wave analysis.
By Tim Bovee, Portland, Oregon, March 20, 2026
Disclaimer
Tim Bovee, Private Trader tracks the analysis and trades of a private trader for his own accounts. Nothing in this blog constitutes a recommendation to buy or sell stocks, options or any other financial instrument. The only purpose of this blog is to provide education and entertainment.
No trader is ever 100 percent successful in his or her trades. Trading in the stock and option markets is risky and uncertain. Each trader must make trading decisions for his or her own account, and take responsibility for the consequences.
All content on Tim Bovee, Private Trader by Timothy K. Bovee is licensed under a Creative Commons Attribution-ShareAlike 4.0 International License.
Based on work at www.timbovee.com

You must be logged in to post a comment.