3:30 p.m. New York time
Half an hour before the closing bell. The S&P 500 futures traded within a range during the session, reaching a low of 6573.50 and a high of about 6646. The contract continued to fluctuate between those levels into the afternoon.
Elliott Wave Theory: Falling wave B{-7} appears to be continuing. This wave is a subwave of rising wave B{-6}, which in turn is part of the larger decline in wave C{-5}. Together, these degrees form part of wave 4{-4}, a downward correction that began on October 29, 2025.
The structure remains unresolved, suggesting that further sideways movement or additional subdivision may occur before the next directional move develops.
9:40 a.m. New York time
What’s happening now? The S&P 500 E-mini futures fell from the 6650s to the 6580s and then rose again into the 6650s, thereafter declining once more, back into the 6590s. The contract has remained well below Monday’s peak at 6748 and well above Monday’s low at 6483.50.
What does it mean? Elliott Wave Theory applied to the decline that began on January 27 remains ambiguous. The issue is one of duration.
Under the theory, waves of the same degree tend to take roughly similar amounts of time to unfold. This is not an unbreakable rule, but rather a recurring tendency that often helps in judging degree.
The decline from January 27 appears to mark the start of wave C{-5} and its subwave A{-6}, which ended on March 22. The question is how to label the rise that followed.
One possibility is that the rise marked the start and completion of wave B{-6}. But that interpretation would imply that a {-6}-degree wave lasting nearly two months was followed by another wave of the same degree lasting only a single day — an inelegant proportion.
The labeling used here instead treats A{-6} as ending on March 22 and sees rising wave B{-6} as still underway. The sharp one-day advance is counted as subwave A{-7}, with wave B{-7} now in progress.
An alternative interpretation — and one that could still develop — is that wave A{-7} remains incomplete. Under that view, the one-day advance would be only wave A{-8}, and the subsequent decline would be wave B{-8}.
As always with Elliott Wave Theory, the structure will become clearer with time.
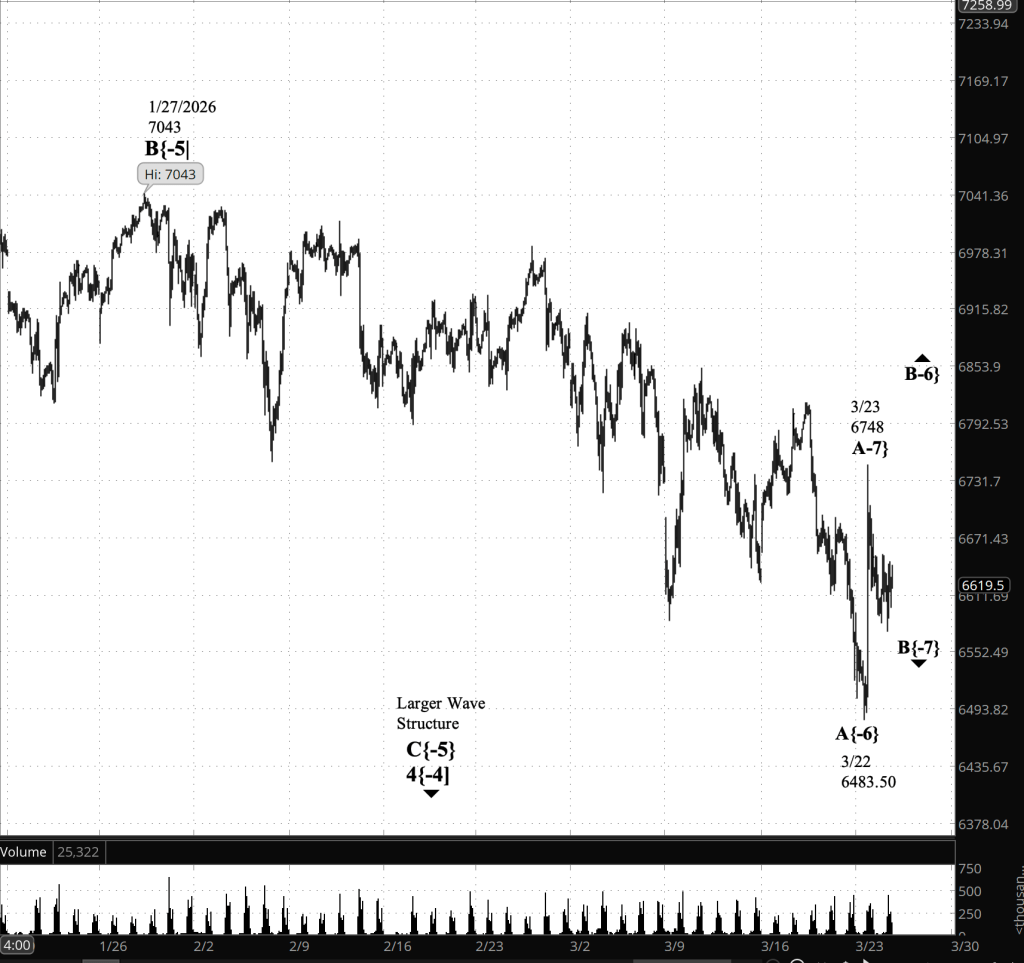
[S&P 500 E-mini futures at 3:30 p.m., 4-hour bars with volume]
Waves Now Underway
These are the waves currently in progress under my principal analysis. Each line on the list shows the wave number, with the subscript in curly brackets, the traditional degree name, the starting date, the starting price of the S&P 500 E-mini futures, and the direction of the wave.
- S&P 500 Index:
- 5{+3} Supercycle, 7/8/1932, 4.40 (up)
- 5{+2} Cycle, 12/9/1974, 60.96 (up)
- 5{+1} Primary, 3/6/2009, 666.79 (up)
- 5{0} Intermediate, 2/11/2016, 1810.10 (up)
- 3{-1} Minor, 3/23/2020, 2191.36 (up)
- 1{-2} Minute, 7/31/2025, 6468.50 (down)
- S&P 500 E-mini futures
- 5{-3} Minuette 8/1/2025, 6239.50 (up}
- 4{-4} Subminutte 10/29/2025, 6953.75 (down}
- C{-5} Micro, 1/27/2026, 7043 (down}
- B{-6} (none), 3/22/2026, 6483.50 (up}
- B{-7} (none), 3/23/2026, 6748 (down)
Reading the chart. Price movements — waves – – in Elliott Wave Theory analysis are labeled with numbers within trending waves and letters with corrective waves. The subscripts — numbers in curly brackets — designate the wave’s degree, which, in Elliott Wave analysis, means the relative position of a wave within the larger and smaller structures that make up the chart. R.N. Elliott, who in the 1930s developed the form of analysis that bears his name, viewed the chart as a complex structure of smaller waves nested within larger waves, which in turn are nested within still larger waves. In mathematics it’s called a fractal structure, where at every scale the pattern is similar to the others.
Learning and other resources. Elliott Wave analysis provides context, not prophecy. As the 20th century semanticist Alfred Korzybski put it in his book Science and Sanity (1933), “The map is not the territory … The only usefulness of a map depends on similarity of structure between the empirical world and the map.” And I would add, in the ever-changing markets, we can judge that similarity of structure only after the fact.
See the menu page Analytical Methods for a rundown on where to go for information on Elliott Wave analysis.
By Tim Bovee, Portland, Oregon, March 24, 2026
Disclaimer
Tim Bovee, Private Trader tracks the analysis and trades of a private trader for his own accounts. Nothing in this blog constitutes a recommendation to buy or sell stocks, options or any other financial instrument. The only purpose of this blog is to provide education and entertainment.
No trader is ever 100 percent successful in his or her trades. Trading in the stock and option markets is risky and uncertain. Each trader must make trading decisions for his or her own account, and take responsibility for the consequences.
All content on Tim Bovee, Private Trader by Timothy K. Bovee is licensed under a Creative Commons Attribution-ShareAlike 4.0 International License.
Based on work at www.timbovee.com

You must be logged in to post a comment.