9:35 a.m. New York time
What’s happening now? The S&P 500 E-mini futures broke free from their narrow range overnight, falling from an early peak at 6647 down into the 6570s. The release of the Weekly Jobless Claims report an hour before the opening bell had little lasting impact on price.
What does it mean? Elliott Wave Theory analysis views the decline as a continuation of declining wave B{-7} within rising wave B{-6} within falling wave C{-5}. The entire structure remains part of wave 4{-4}, a downward correction that began on October 29, 2025.
An alternative interpretation would label the present decline one degree lower, as wave B{-8} within wave B{-7}. At present, the evidence does not appear strong enough to support that possibility.
Decision points: The overnight break from the narrow range puts the focus squarely on 6574.25, the session low so far. A sustained move below 6574 would strengthen the case that declining wave B{-7} is still extending and could open the way toward the 6550–6525 zone next. Conversely, a recovery back above 6625 would suggest the decline is losing momentum and returning to triangle-style overlap. A push through 6647, the overnight high, would further weaken the bearish case and argue that the present move is only another internal subwave within the broader corrective structure rather than the start of a deeper directional leg.
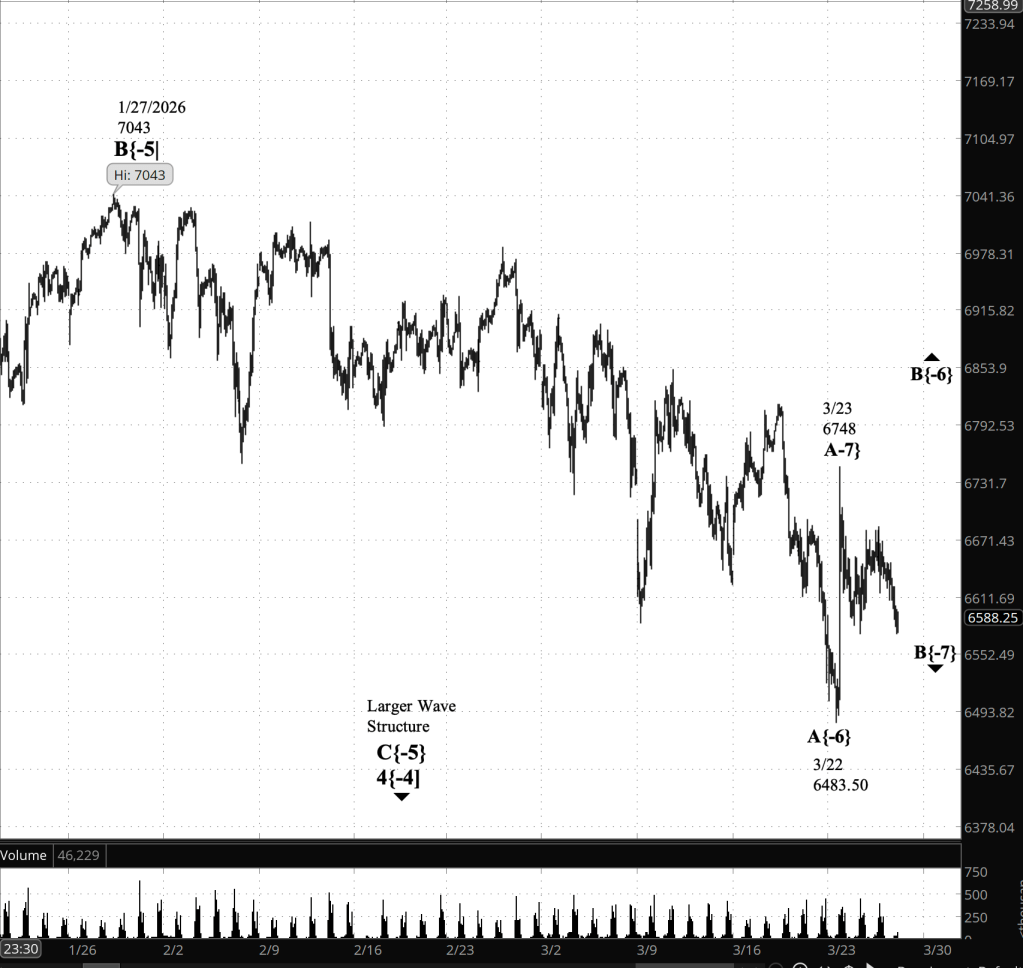
[S&P 500 E-mini futures at 9:35 a.m., 90-minute bars with volume]
Waves Now Underway
These are the waves currently in progress under my principal analysis. Each line on the list shows the wave number, with the subscript in curly brackets, the traditional degree name, the starting date, the starting price of the S&P 500 E-mini futures, and the direction of the wave.
- S&P 500 Index:
- 5{+3} Supercycle, 7/8/1932, 4.40 (up)
- 5{+2} Cycle, 12/9/1974, 60.96 (up)
- 5{+1} Primary, 3/6/2009, 666.79 (up)
- 5{0} Intermediate, 2/11/2016, 1810.10 (up)
- 3{-1} Minor, 3/23/2020, 2191.36 (up)
- 1{-2} Minute, 7/31/2025, 6468.50 (down)
- S&P 500 E-mini futures
- 5{-3} Minuette 8/1/2025, 6239.50 (up}
- 4{-4} Subminutte 10/29/2025, 6953.75 (down}
- C{-5} Micro, 1/27/2026, 7043 (down}
- B{-6} (none), 3/22/2026, 6483.50 (up}
- B{-7} (none), 3/23/2026, 6748 (down)
Reading the chart. Price movements — waves – – in Elliott Wave Theory analysis are labeled with numbers within trending waves and letters with corrective waves. The subscripts — numbers in curly brackets — designate the wave’s degree, which, in Elliott Wave analysis, means the relative position of a wave within the larger and smaller structures that make up the chart. R.N. Elliott, who in the 1930s developed the form of analysis that bears his name, viewed the chart as a complex structure of smaller waves nested within larger waves, which in turn are nested within still larger waves. In mathematics it’s called a fractal structure, where at every scale the pattern is similar to the others.
Learning and other resources. Elliott Wave analysis provides context, not prophecy. As the 20th century semanticist Alfred Korzybski put it in his book Science and Sanity (1933), “The map is not the territory … The only usefulness of a map depends on similarity of structure between the empirical world and the map.” And I would add, in the ever-changing markets, we can judge that similarity of structure only after the fact.
See the menu page Analytical Methods for a rundown on where to go for information on Elliott Wave analysis.
By Tim Bovee, Portland, Oregon, March 26, 2026
Disclaimer
Tim Bovee, Private Trader tracks the analysis and trades of a private trader for his own accounts. Nothing in this blog constitutes a recommendation to buy or sell stocks, options or any other financial instrument. The only purpose of this blog is to provide education and entertainment.
No trader is ever 100 percent successful in his or her trades. Trading in the stock and option markets is risky and uncertain. Each trader must make trading decisions for his or her own account, and take responsibility for the consequences.
All content on Tim Bovee, Private Trader by Timothy K. Bovee is licensed under a Creative Commons Attribution-ShareAlike 4.0 International License.
Based on work at www.timbovee.com
