9:35 a.m. New York time
What’s happening now? The S&P 500 E-mini futures opened Sunday evening with a small opening gap to the downside and continued lower, reaching 6360.25. From that point, the market rose into the 6450s. At one point, the price briefly spiked to 6481.75 with a rise in volume, then quickly retreated to the 6450s.
What does it mean? The larger Elliott Wave Theory structure remains unchanged. The market continues to trace out falling wave A{-6}, a subwave of wave C{-5} within the broader 4{-4} expanding triangle. The new low, 6360.25, supports the view that wave A{-6} had not yet completed on Friday.
The principal analysis remains in place: Wave A{-6} is underway, with the overnight rally representing a smaller-degree countertrend move within it. Under this view, one more downward leg—likely completing the internal structure of A{-6}—remains to be seen before a durable countertrend rally in wave B{-6} begins.
An alternate scenario is that A{-6} completed at 6360.25 and that the move to 6481.75 marked the beginning of wave B{-6}. However, confirmation of that interpretation would require sustained upside follow-through that is not yet evident.
Decision Points.
- Upside confirmation (B{-6} underway): A sustained move above 6485–6500, with pullbacks holding above roughly 6460, would indicate that A{-6} has completed and that a countertrend rally in B{-6} is in progress.
- Downside continuation (A{-6} still active): Failure below the 6480 area, followed by a break under 6420 and especially below 6360.25, would confirm that A{-6} remains incomplete and that another downward leg is unfolding.
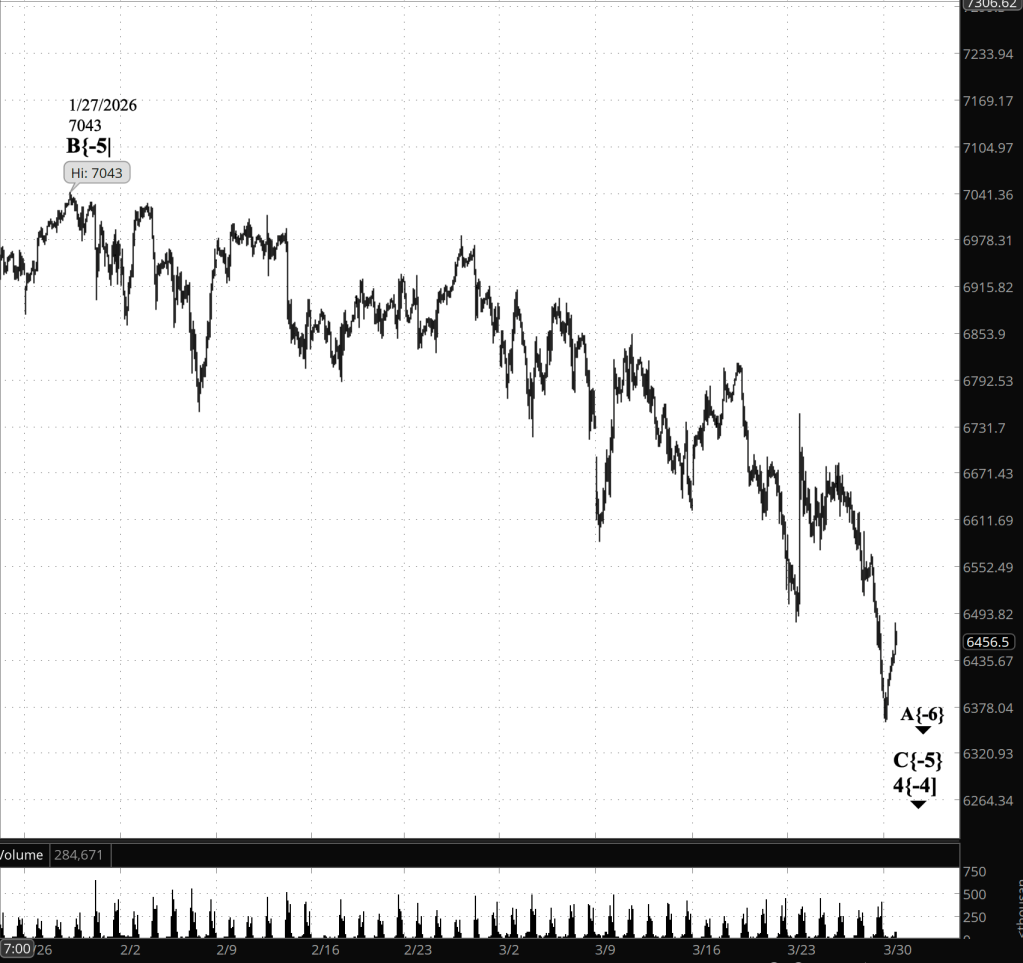
[S&P 500 E-mini futures at 9:35 a..m., 90-minute bars with volume]
Waves Now Underway
These are the waves currently in progress under my principal analysis. Each line on the list shows the wave number, with the subscript in curly brackets, the traditional degree name, the starting date, the starting price of the S&P 500 E-mini futures, and the direction of the wave.
- S&P 500 Index:
- 5{+3} Supercycle, 7/8/1932, 4.40 (up)
- 5{+2} Cycle, 12/9/1974, 60.96 (up)
- 5{+1} Primary, 3/6/2009, 666.79 (up)
- 5{0} Intermediate, 2/11/2016, 1810.10 (up)
- 3{-1} Minor, 3/23/2020, 2191.36 (up)
- 1{-2} Minute, 7/31/2025, 6468.50 (down)
- S&P 500 E-mini futures
- 5{-3} Minuette 8/1/2025, 6239.50 (up}
- 4{-4} Subminutte 10/29/2025, 6953.75 (down}
- C{-5} Micro, 1/27/2026, 7043 (down}
- A{-6} (none), 1/27/2026, 7043 (down}
Reading the chart. Price movements — waves – – in Elliott Wave Theory analysis are labeled with numbers within trending waves and letters with corrective waves. The subscripts — numbers in curly brackets — designate the wave’s degree, which, in Elliott Wave analysis, means the relative position of a wave within the larger and smaller structures that make up the chart. R.N. Elliott, who in the 1930s developed the form of analysis that bears his name, viewed the chart as a complex structure of smaller waves nested within larger waves, which in turn are nested within still larger waves. In mathematics it’s called a fractal structure, where at every scale the pattern is similar to the others.
Learning and other resources. Elliott Wave analysis provides context, not prophecy. As the 20th century semanticist Alfred Korzybski put it in his book Science and Sanity (1933), “The map is not the territory … The only usefulness of a map depends on similarity of structure between the empirical world and the map.” And I would add, in the ever-changing markets, we can judge that similarity of structure only after the fact.
See the menu page Analytical Methods for a rundown on where to go for information on Elliott Wave analysis.
By Tim Bovee, Portland, Oregon, March 30, 2026
Disclaimer
Tim Bovee, Private Trader tracks the analysis and trades of a private trader for his own accounts. Nothing in this blog constitutes a recommendation to buy or sell stocks, options or any other financial instrument. The only purpose of this blog is to provide education and entertainment.
No trader is ever 100 percent successful in his or her trades. Trading in the stock and option markets is risky and uncertain. Each trader must make trading decisions for his or her own account, and take responsibility for the consequences.
All content on Tim Bovee, Private Trader by Timothy K. Bovee is licensed under a Creative Commons Attribution-ShareAlike 4.0 International License.
Based on work at www.timbovee.com
