Trader’s Notebook: S&P 500

3:30 p.m. New York time

Half an hour before the closing bell. The S&P 500 futures reached a low of 6718.75 during the session, and then began to rise. So far it has reached into the 6850s.

Elliott Wave Theory. The low point in today’s session either marks the end of wave 3{-7} or the end of wave 1{-8} within wave 3{-7}. It’s not yet possible to say for sure which has occured. The rise that followed is either the beginning of wave 4{-7} or the start of wave 2{-8} within wave 3{-7}. The entire structured is within downtrending wave 5{-6}, which has been underway since February 25.

Right now price is roughly testing the former breakdown area around 6830–6850. If this rally stalls below that zone, the interpretation tilts toward a smaller-degree correction (2{-8}). If price continues higher and begins to overlap deeper into prior structure, the odds increase that 3{-7} has completed and 4{-7} is underway.

The downtrend remains intact, but the first meaningful counter-move has appeared. Likelihood still favors further downside while price remains below the breakdown zone, but certainty now depends on whether this rally can sustain itself beyond former support turned resistance.

9:35 a.m. New York time.

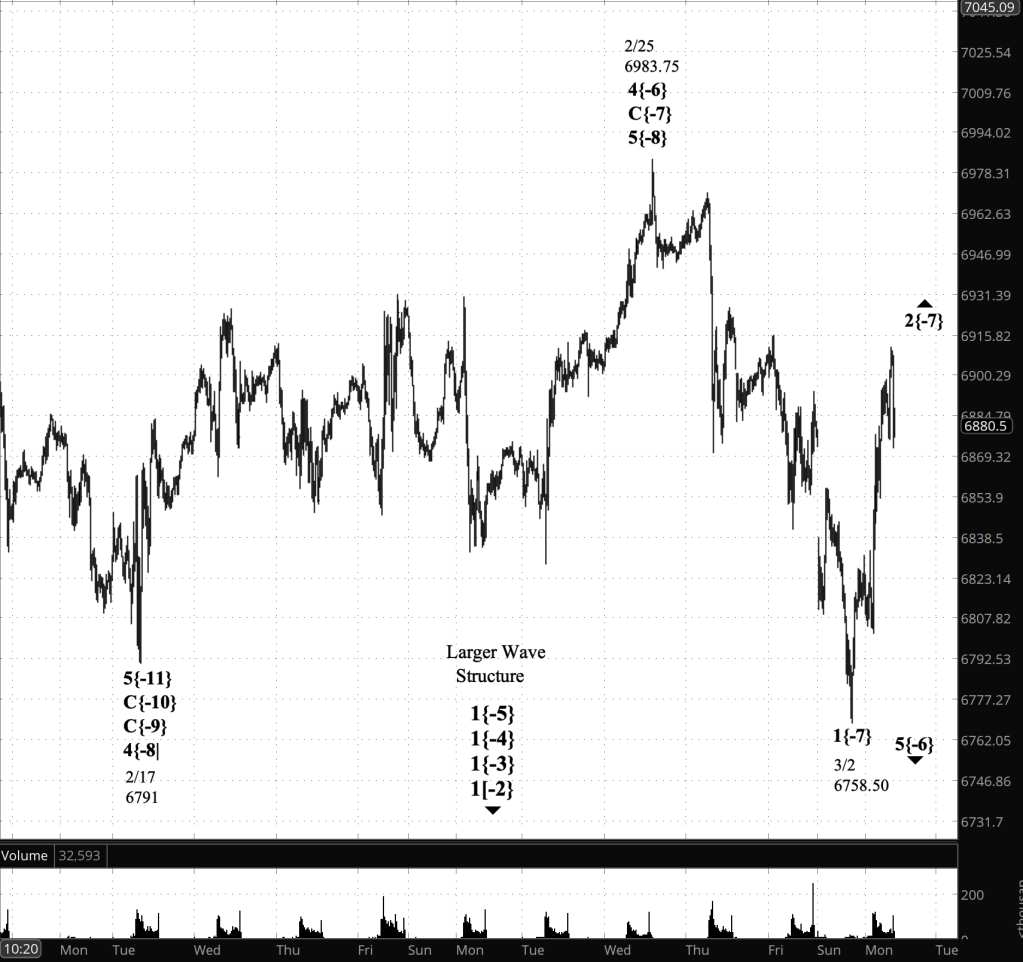
What’s happening now. The S&P 500 E-mini futures continued to fall after yesterday’s closing bell, carrying price from about 6885 down to a low so far of 6742.75. Price then bounced, retracing toward 6800.

What does it mean? Elliott Wave Theory continues to support a downtrending wave 5{-6}. Today’s decline appears to be the strong middle leg of that move—declining wave 3 of one degree or another.

Degree note. There is still ambiguity about whether today’s selloff is labeled 3{-7} (one degree below 5{-6}) or a smaller-degree 3{-8} within 1{-7}. For now, that ambiguity does not change the trading read: the tape remains bearish until price proves otherwise.

Decision points. The downtrend remains intact while price holds below 6800 and especially below 6886. Holding above 6742.75 favors a near-term corrective bounce; breaking below 6742.75 favors continued downside extension.

The decline remains in force unless and until price can reclaim and hold above 6800. A break below 6742.75 would argue that the heart of the selloff is still unfolding. Two lenses, one chart: likelihood favors continued downside pressure, certainty lies at the reclaim of resistance.

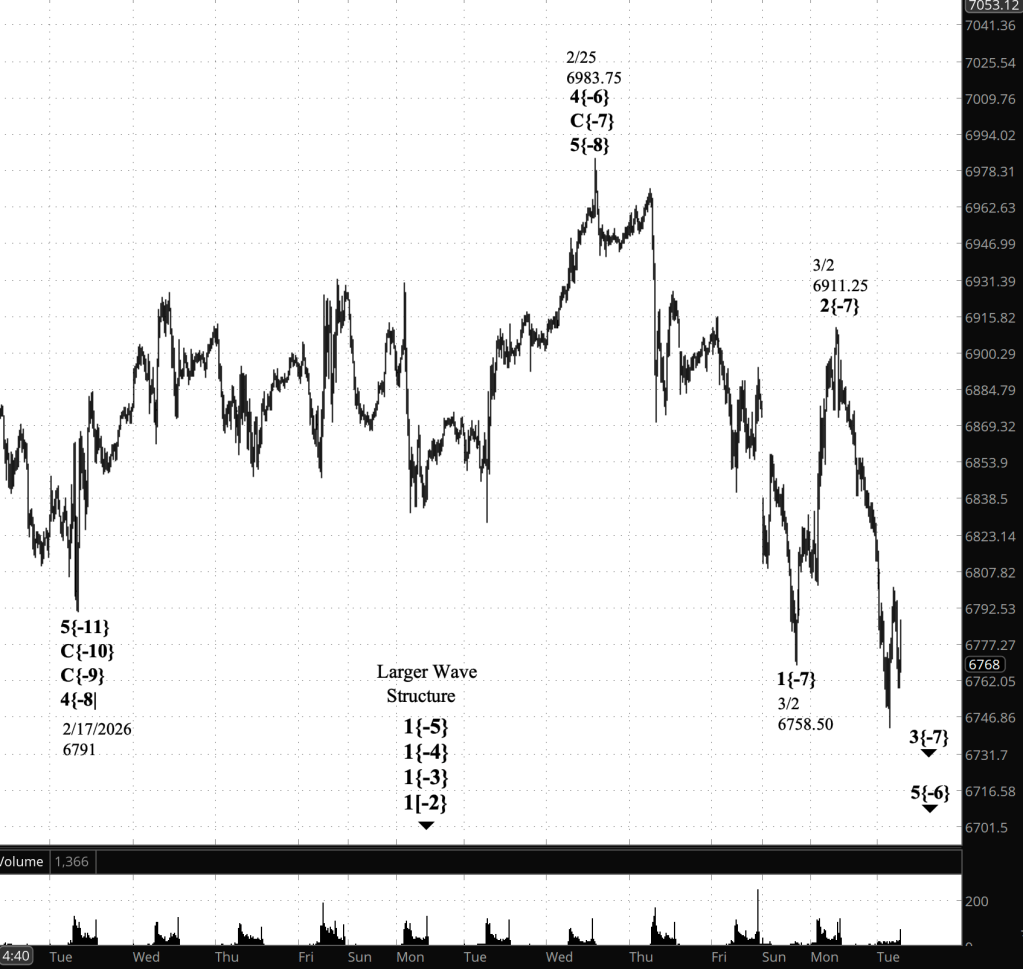
[S&P 500 E-mini futures at 3:30 ;.m., 20-minute bars, with volume]

Waves Now Underway

These are the waves currently in progress under my principal analysis. Each line on the list shows the wave number, with the subscript in curly brackets, the traditional degree name, the starting date, the starting price of the S&P 500 E-mini futures, and the direction of the wave.

  • 1{+4} Supermillennium, (unknown start date or start price) {down}
    • A hypothetical wave one degree higher than Supercyle, needed to make the wave analysis complete.
  • S&P 500 Index:
    • 1{+3} Supercycle, 10/8/2025, 6812.25 (down}
    • 1{+2} Cycle, 10/8/2025, 6812.25 (down}
    • 1{+1} Primary, 10/8/2025, 6812.25 (down}
    • 1{0} Intermediate, 10/8/2025, 6812.25 (down}
    • 1{-1} Minor, 10/8/2025, 6812.25 (down}
    • 1{-2} Minute, 10/8/2025, 6812.25 (down}
  • S&P 500 Futures
    • 1{-3} Minuette 10/8/2025, 6812.25 (down}
    • 1{-4} Subminutte 10/8/2025, 6812.25 (down}
    • 1{-5} Micro, 10/8/2025, 6812.25 (down}
    • 5{-6} Submicro, 2/25/2026, 6983.75 (down)
    • 4{-7} Minuscule, 3/3/2026, 6718.75 (up)

Reading the chart. Price movements — waves – – in Elliott Wave Theory analysis are labeled with numbers within trending waves and letters with corrective waves. The subscripts — numbers in curly brackets — designate the wave’s degree, which, in Elliott Wave analysis, means the relative position of a wave within the larger and smaller structures that make up the chart. R.N. Elliott, who in the 1930s developed the form of analysis that bears his name, viewed the chart as a complex structure of smaller waves nested within larger waves, which in turn are nested within still larger waves. In mathematics it’s called a fractal structure, where at every scale the pattern is similar to the others.

Learning and other resources. Elliott Wave analysis provides context, not prophecy. As the 20th century semanticist Alfred Korzybski put it in his book Science and Sanity (1933), “The map is not the territory … The only usefulness of a map depends on similarity of structure between the empirical world and the map.” And I would add, in the ever-changing markets, we can judge that similarity of structure only after the fact.

See the menu page Analytical Methods for a rundown on where to go for information on Elliott Wave analysis.

By Tim Bovee, Portland, Oregon, March 3, 2026

Disclaimer

Tim Bovee, Private Trader tracks the analysis and trades of a private trader for his own accounts. Nothing in this blog constitutes a recommendation to buy or sell stocks, options or any other financial instrument. The only purpose of this blog is to provide education and entertainment.

No trader is ever 100 percent successful in his or her trades. Trading in the stock and option markets is risky and uncertain. Each trader must make trading decisions for his or her own account, and take responsibility for the consequences.

All content on Tim Bovee, Private Trader by Timothy K. Bovee is licensed under a Creative Commons Attribution-ShareAlike 4.0 International License.

License

Based on work at www.timbovee.com

Trader’s Notebook: S&P 500

3:30 p.m. New York time

Half an hour before the closing bell. The S&P 500 futures began to rise overnight, reversing the earlier downward opening gap and subsequent decline. The rally continued throughout the session, reaching into the 6910s and then pulling back, so far into the 6870s.

Elliott Wave Theory. The decline from the February 25 high at 6983.75 is counted as the beginning of downtrending wave 5{-6}. The low at 6758.50 appears to mark the end of the first subwave within that decline, wave 1{-7}. The subsequent rise from that low is most likely the second subwave, a corrective wave 2{-7}.

It is also possible that wave 1{-7} is still unfolding, and that the fluctuations now visible represent lower-degree waves 1{-8} and 2{-8} within it. As always in real time, there is some degree of uncertainty regarding wave degree.

The day’s rally does not require a new map. It reflects the uncovering of additional internal detail within the existing structure — a routine occurrence in Elliott Wave analysis.

Second waves often retrace deeply and can approach the origin of the first wave without altering the larger trend.

Decision levels:

6758.50 (today’s low): A break below would resume the decline and raise the probability that a third wave down is underway.

6900–6907 (today’s high zone): Sustained trade above this area would extend the retracement and increase pressure on short positions.

6983.75 (February 25 high): A move above this level would seriously challenge the 5{-6} down interpretation.

6875 (Friday’s close): A useful line in the sand for whether the rally is holding into the close and potentially into the next session.

9:35 a.m. New York time.

What’s happening now. The S&P 500 E-mini futures opened with a gap when trading resumed overnight. The U.S. was at peace when Friday trading ended at 6875.25. The nation was at war with Iran when trading reopened Sunday at 6820. Prices continued to decline overnight, reaching a low so far of 6768.50.

What does it mean? Elliott Wave Theory treats the decline that began in late December as proof that the prior count no longer matches the chart.

In the revised map, the rise into February 25 completed wave 5{-8}. That high also completed the two larger-degree waves that encompassed it: wave C{-7} and wave 4{-6}. From there, downtrending wave 5{-6} began and has continued lower.

The tip-off came when what had been labeled wave 4{-9} (as a subwave within 5{-8} under the prior count) fell below the start of wave 1{-9}. That overlap should not occur in an impulse. When it does appear to occur, the conclusion is simple: the count is wrong, and the map must be redrawn to match the terrain.

The chart below shows the revised wave map.

If downtrending wave 5{-6} completes as expected, it would also complete a larger sequence that includes parent wave 1{-5}, which began on October 8, 2025—within a still larger chain of first waves that traces back many decades. (See my October 12, 2025 essay, “The End of the Rise from 1932? Elliott Wave Theory Says ‘Yes’,” for how that larger structure developed.)

Here are the decision points, as prepared by the AI ChatGPT:

  • 6857 (today’s intraday high)
    Reclaiming and holding above 6857 shifts “what’s happening now” from free-fall to a short-covering / corrective bounce. It does not disprove 5{-6} down, but it would argue for a larger corrective wave before the next leg.
  • 6820 (Sunday reopen / gap reference)
    Trading below 6820 keeps the gap-and-go downside pressure intact. Trading back above 6820 reduces immediate downside urgency and supports the bounce case.
  • 6768.50 (today’s low so far)
    Break below 6768.50 resumes the decline and puts the market back into impulsive-trend behavior intraday.
  • 6751.50 (Feb 5 swing low on the 75m chart)
    This is the next “structural” downside trigger. A clean break below 6751.50 would strengthen the case that 5{-6} is extending and that the market is not simply chopping inside the February range.
  • 6790–6800 (near-term pivot zone)
    This is the “tell” area during the session: holding above it supports stabilization; losing it tends to reopen the path to 6768.50 and then 6751.50.

[S&P 500 E-mini futures at 3:30 p.m., 20-minute bars, with volume]

Waves Now Underway

These are the waves currently in progress under my principal analysis. Each line on the list shows the wave number, with the subscript in curly brackets, the traditional degree name, the starting date, the starting price of the S&P 500 E-mini futures, and the direction of the wave.

Most of the waves began not long ago, on October 8, 2025. See my essay posted on October 12, 2025, “The End of the Rise from 1932? Elliott Wave Theory Says ‘Yes’”, for a discussion of how that happened.

The difficult problem of estimating when a wave change should be accept as real rather than a headfake is addressed by the essay titled, “Is This Reversal Real?: How to Tell Without Being Whipsawed”.

  • 1{+4} Supermillennium, (unknown start date or start price) {down}
    • A hypothetical wave one degree higher than Supercyle, needed to make the wave analysis complete.
  • S&P 500 Index:
    • 1{+3} Supercycle, 10/8/2025, 6812.25 (down}
    • 1{+2} Cycle, 10/8/2025, 6812.25 (down}
    • 1{+1} Primary, 10/8/2025, 6812.25 (down}
    • 1{0} Intermediate, 10/8/2025, 6812.25 (down}
    • 1{-1} Minor, 10/8/2025, 6812.25 (down}
    • 1{-2} Minute, 10/8/2025, 6812.25 (down}
  • S&P 500 Futures
    • 1{-3} Minuette 10/8/2025, 6812.25 (down}
    • 1{-4} Subminutte 10/8/2025, 6812.25 (down}
    • 1{-5} Micro, 10/8/2025, 6812.25 (down}
    • 5{-6} Submicro, 2/25/2026, 6983.75 (down)
    • 2{-7} Minuscule, 3/2/2026, 6758.50 (up)

Reading the chart. Price movements — waves – – in Elliott Wave Theory analysis are labeled with numbers within trending waves and letters with corrective waves. The subscripts — numbers in curly brackets — designate the wave’s degree, which, in Elliott Wave analysis, means the relative position of a wave within the larger and smaller structures that make up the chart. R.N. Elliott, who in the 1930s developed the form of analysis that bears his name, viewed the chart as a complex structure of smaller waves nested within larger waves, which in turn are nested within still larger waves. In mathematics it’s called a fractal structure, where at every scale the pattern is similar to the others.

Learning and other resources. Elliott Wave analysis provides context, not prophecy. As the 20th century semanticist Alfred Korzybski put it in his book Science and Sanity (1933), “The map is not the territory … The only usefulness of a map depends on similarity of structure between the empirical world and the map.” And I would add, in the ever-changing markets, we can judge that similarity of structure only after the fact.

See the menu page Analytical Methods for a rundown on where to go for information on Elliott Wave analysis.

By Tim Bovee, Portland, Oregon, March 2, 2026

Disclaimer

Tim Bovee, Private Trader tracks the analysis and trades of a private trader for his own accounts. Nothing in this blog constitutes a recommendation to buy or sell stocks, options or any other financial instrument. The only purpose of this blog is to provide education and entertainment.

No trader is ever 100 percent successful in his or her trades. Trading in the stock and option markets is risky and uncertain. Each trader must make trading decisions for his or her own account, and take responsibility for the consequences.

All content on Tim Bovee, Private Trader by Timothy K. Bovee is licensed under a Creative Commons Attribution-ShareAlike 4.0 International License.

License

Based on work at www.timbovee.com