3:30 p.m. New York time
Half an hour before the closing bell. The S&P 500 futures have spent the session fluctuating within a narrow range, roughly from the 6630s down into the 6620s. Price action has been choppy and overlapping, with no sustained directional push.
Elliott Wave Theory. Rising wave B{-6} continues, but the advance has stalled into sideways movement. The session’s price action is best interpreted as a continuation of an internal consolidation rather than a completed reversal. The structure remains consistent with a developing corrective pattern within B{-6}, rather than the start of a new downward impulse.
There is no evidence at this stage of a decisive break either higher or lower. Instead, the market remains beneath the April 1 high at 6663.75.
Decision Points. The April 1 high at 6663.75 remains the immediate upside barrier. A sustained move above that level would confirm continuation of wave B{-6} and open the path toward the upper end of the 6620–6680 resistance zone, with the potential for a modest extension.
On the downside, the 6620–6630 area continues to serve as the near-term pivot. Holding above that zone supports the view that the market is consolidating within B{-6}. A break below 6600 would weaken that interpretation and suggest that the rally is losing structure.
The overnight low at 6567 remains the key near-term support. A move below that level would indicate that the current upward leg has likely completed and that a deeper correction is underway. The broader wave structure remains intact as long as price holds above 6353.25, the low of wave A{-6}.
9:35 a.m. New York time
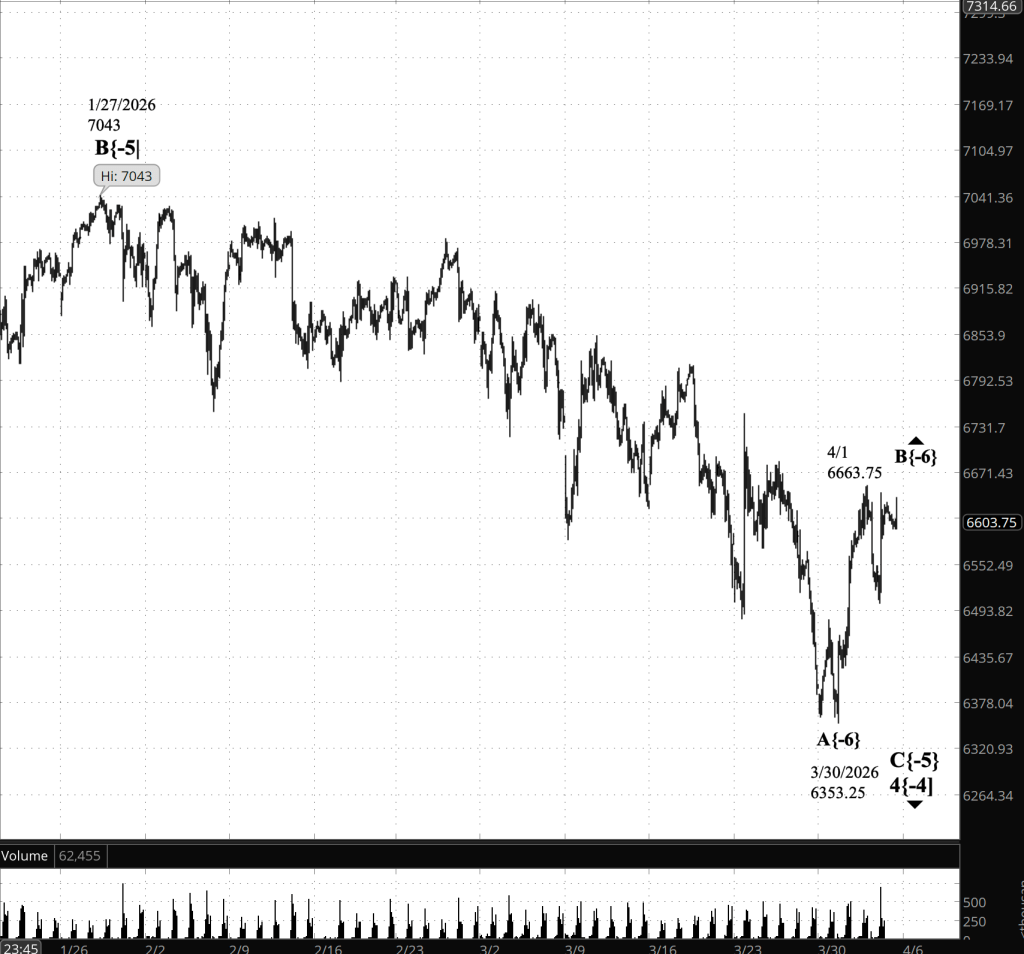
What’s happening now. The S&P 500 E-mini futures resumed trading last night with a small opening gap to the downside. The price reached an overnight low of 6567 within the first 15 minutes, then turned higher, rising to a peak of 6651.25. It has since pulled back slightly in a shallow, orderly correction.
What does it mean? Elliott Wave Theory analysis interprets the rise as evidence that wave B{-6} continues to advance. So far, the rally remains below its prior high of 6663.75, set on April 1.
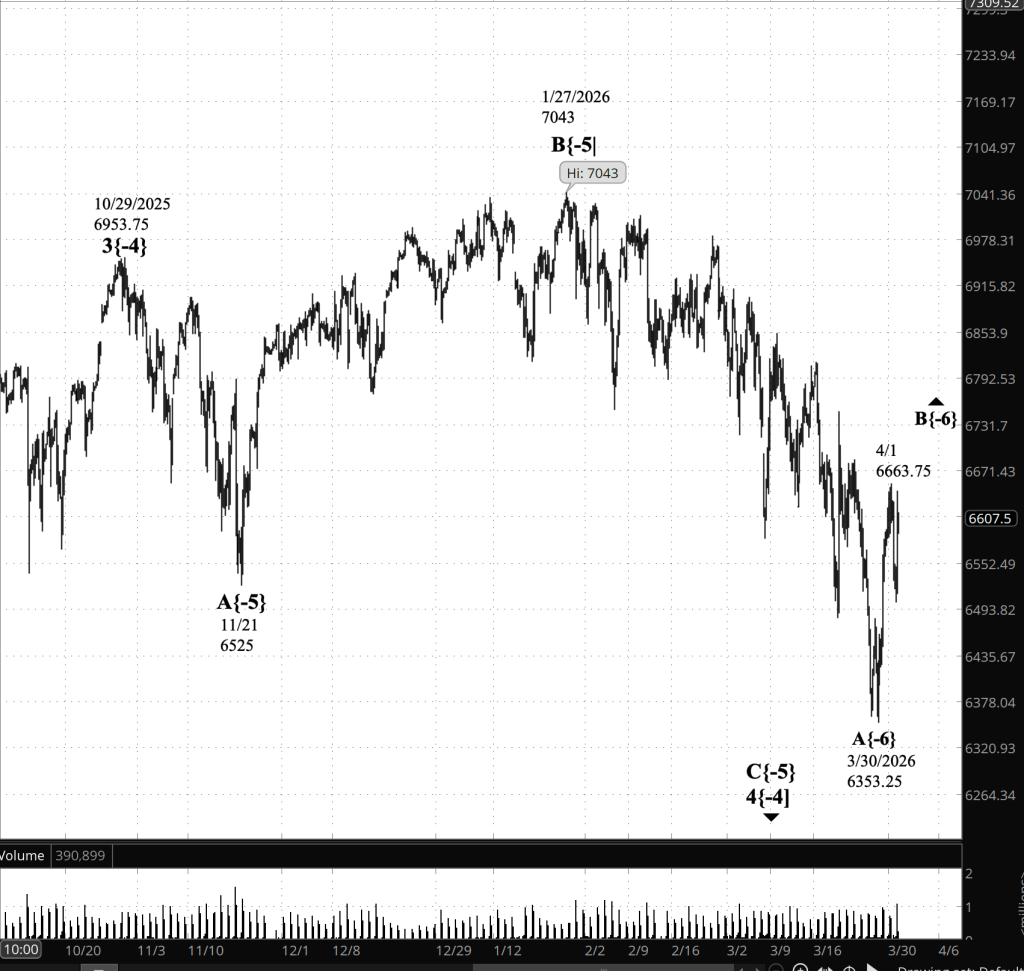
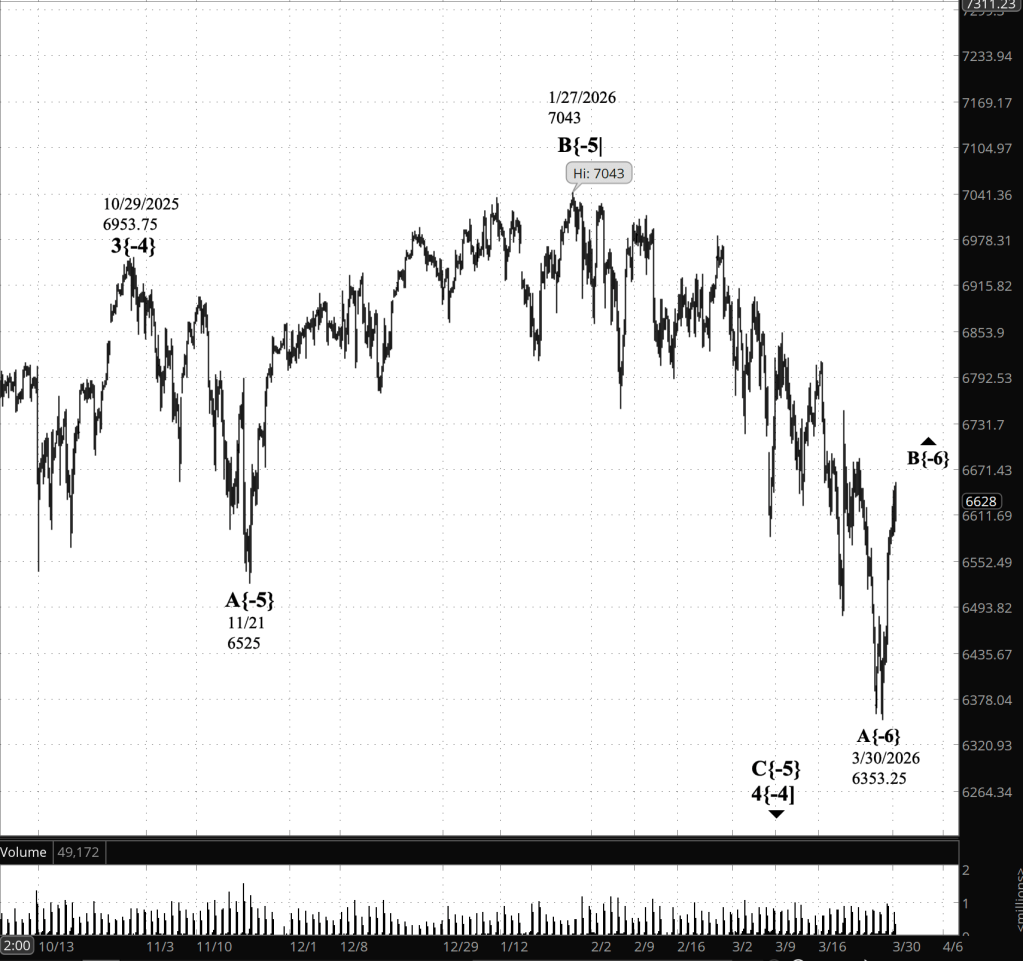
Wave B{-6} is a subwave within falling wave C{-5}, itself part of a larger corrective wave, 4{-4}. That correction continues to take the form of an expanding triangle.
The current pullback appears corrective rather than impulsive, suggesting that the rising structure of B{-6} remains intact for now.
Decision Points. The April 1 high at 6663.75 remains the immediate ceiling. A sustained move above that level would confirm continuation of wave B{-6}, with the next likely target in or slightly above the 6620–6680 resistance zone.
On the downside, the 6620–6630 area serves as a near-term pivot. Holding above that zone supports the view that the present pullback is a shallow internal correction. A break below 6600 would weaken the rising structure and suggest that the rally is losing momentum.
The overnight low at 6567 is the key near-term support. A move below that level would indicate that the current upward leg has likely completed and that a deeper correction is underway. The larger structure remains intact as long as price holds above 6353.25, the low of wave A{-6}.
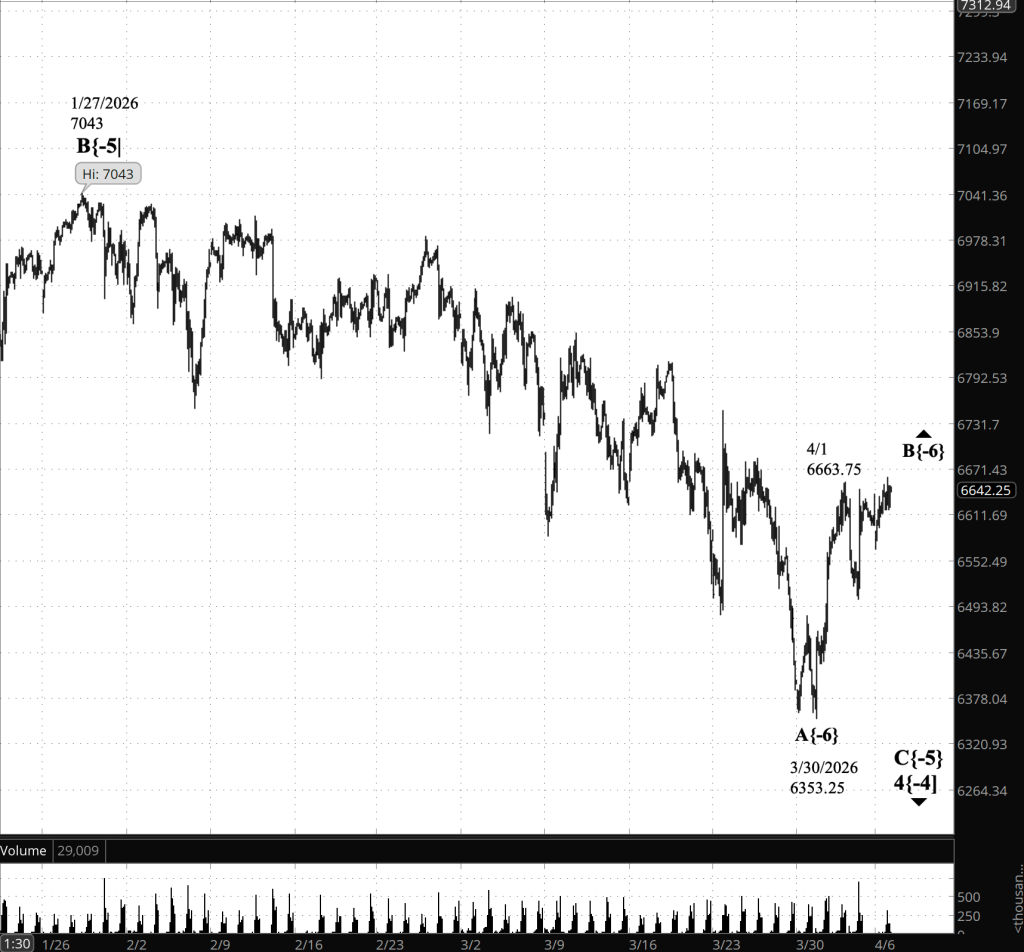
[S&P 500 E-mini futures at 3:30 p.m., 105-minute bars with volume]
Waves Now Underway
These are the waves currently in progress under my principal analysis. Each line on the list shows the wave number, with the subscript in curly brackets, the traditional degree name, the starting date, the starting price of the S&P 500 E-mini futures, and the direction of the wave.
- S&P 500 Index:
- 5{+3} Supercycle, 7/8/1932, 4.40 (up)
- 5{+2} Cycle, 12/9/1974, 60.96 (up)
- 5{+1} Primary, 3/6/2009, 666.79 (up)
- 5{0} Intermediate, 2/11/2016, 1810.10 (up)
- 3{-1} Minor, 3/23/2020, 2191.36 (up)
- 1{-2} Minute, 7/31/2025, 6468.50 (down)
- S&P 500 E-mini futures
- 5{-3} Minuette 8/1/2025, 6239.50 (up}
- 4{-4} Subminutte 10/29/2025, 6953.75 (down}
- C{-5} Micro, 1/27/2026, 7043 (down}
- B{-6} (none), 3/30/2026, 6353.25 (up}
Reading the chart. Price movements — waves – – in Elliott Wave Theory analysis are labeled with numbers within trending waves and letters with corrective waves. The subscripts — numbers in curly brackets — designate the wave’s degree, which, in Elliott Wave analysis, means the relative position of a wave within the larger and smaller structures that make up the chart. R.N. Elliott, who in the 1930s developed the form of analysis that bears his name, viewed the chart as a complex structure of smaller waves nested within larger waves, which in turn are nested within still larger waves. In mathematics it’s called a fractal structure, where at every scale the pattern is similar to the others.
Learning and other resources. Elliott Wave analysis provides context, not prophecy. As the 20th century semanticist Alfred Korzybski put it in his book Science and Sanity (1933), “The map is not the territory … The only usefulness of a map depends on similarity of structure between the empirical world and the map.” And I would add, in the ever-changing markets, we can judge that similarity of structure only after the fact.
See the menu page Analytical Methods for a rundown on where to go for information on Elliott Wave analysis.
By Tim Bovee, Portland, Oregon, April 6, 2026
Disclaimer
Tim Bovee, Private Trader tracks the analysis and trades of a private trader for his own accounts. Nothing in this blog constitutes a recommendation to buy or sell stocks, options or any other financial instrument. The only purpose of this blog is to provide education and entertainment.
No trader is ever 100 percent successful in his or her trades. Trading in the stock and option markets is risky and uncertain. Each trader must make trading decisions for his or her own account, and take responsibility for the consequences.
All content on Tim Bovee, Private Trader by Timothy K. Bovee is licensed under a Creative Commons Attribution-ShareAlike 4.0 International License.
Based on work at www.timbovee.com

You must be logged in to post a comment.