9:35 a.m. New York time
What’s happening now. The S&P 500 E-mini futures rose overnight, spiking to a high of 6643.75 following the release of the ADP National Employment Report for March. The federal government’s Employment Situation Report will be released on Friday, when U.S. markets are closed. The price immediately retreated to 6590.
What does it mean? Elliott Wave Theory analysis sees the rise as further confirmation that wave B{-6} is underway. That wave is a subwave of declining wave C{-5}, which in turn is a subwave of wave 4{-4}, a downward correction that began on October 29, 2025 and is taking the form of an expanding triangle.
Decision Points. The overnight high pushed the price into the 6620–6680 target range, based on resistance levels within the Elliott Wave structure. However, the sharp rejection suggests that wave B{-6} is still unfolding and has not yet reached completion.
A sustained move back above 6620 would signal continuation toward the upper end of the range, while failure below 6560 would suggest the rally has stalled and call the B{-6} count into question.
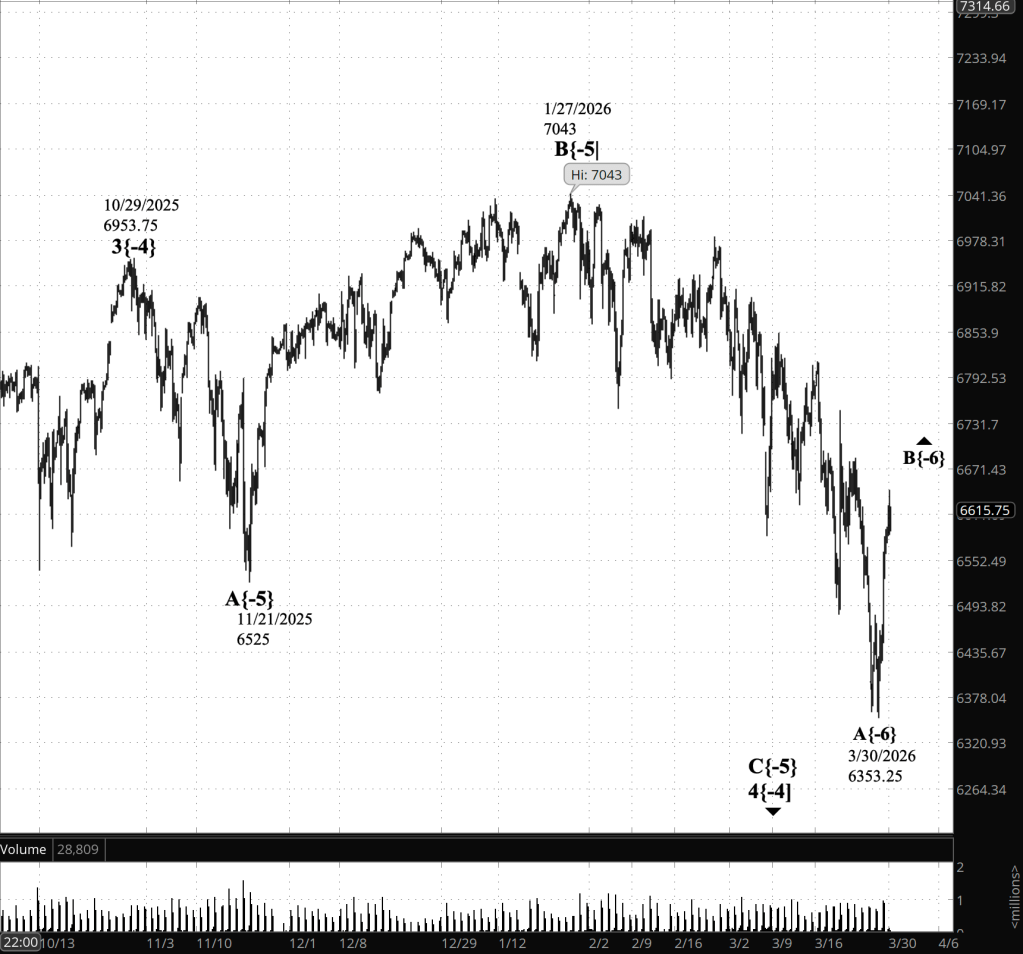
[S&P 500 E-mini futures at 9:35 a.m., 4-hour bars with volume]
Waves Now Underway
These are the waves currently in progress under my principal analysis. Each line on the list shows the wave number, with the subscript in curly brackets, the traditional degree name, the starting date, the starting price of the S&P 500 E-mini futures, and the direction of the wave.
- S&P 500 Index:
- 5{+3} Supercycle, 7/8/1932, 4.40 (up)
- 5{+2} Cycle, 12/9/1974, 60.96 (up)
- 5{+1} Primary, 3/6/2009, 666.79 (up)
- 5{0} Intermediate, 2/11/2016, 1810.10 (up)
- 3{-1} Minor, 3/23/2020, 2191.36 (up)
- 1{-2} Minute, 7/31/2025, 6468.50 (down)
- S&P 500 E-mini futures
- 5{-3} Minuette 8/1/2025, 6239.50 (up}
- 4{-4} Subminutte 10/29/2025, 6953.75 (down}
- C{-5} Micro, 1/27/2026, 7043 (down}
- B{-6} (none), 3/30/2026, 6353.25 (up}
Reading the chart. Price movements — waves – – in Elliott Wave Theory analysis are labeled with numbers within trending waves and letters with corrective waves. The subscripts — numbers in curly brackets — designate the wave’s degree, which, in Elliott Wave analysis, means the relative position of a wave within the larger and smaller structures that make up the chart. R.N. Elliott, who in the 1930s developed the form of analysis that bears his name, viewed the chart as a complex structure of smaller waves nested within larger waves, which in turn are nested within still larger waves. In mathematics it’s called a fractal structure, where at every scale the pattern is similar to the others.
Learning and other resources. Elliott Wave analysis provides context, not prophecy. As the 20th century semanticist Alfred Korzybski put it in his book Science and Sanity (1933), “The map is not the territory … The only usefulness of a map depends on similarity of structure between the empirical world and the map.” And I would add, in the ever-changing markets, we can judge that similarity of structure only after the fact.
See the menu page Analytical Methods for a rundown on where to go for information on Elliott Wave analysis.
By Tim Bovee, Portland, Oregon, April 1, 2026
Disclaimer
Tim Bovee, Private Trader tracks the analysis and trades of a private trader for his own accounts. Nothing in this blog constitutes a recommendation to buy or sell stocks, options or any other financial instrument. The only purpose of this blog is to provide education and entertainment.
No trader is ever 100 percent successful in his or her trades. Trading in the stock and option markets is risky and uncertain. Each trader must make trading decisions for his or her own account, and take responsibility for the consequences.
All content on Tim Bovee, Private Trader by Timothy K. Bovee is licensed under a Creative Commons Attribution-ShareAlike 4.0 International License.
Based on work at www.timbovee.com
