3:30 p.m. New York time
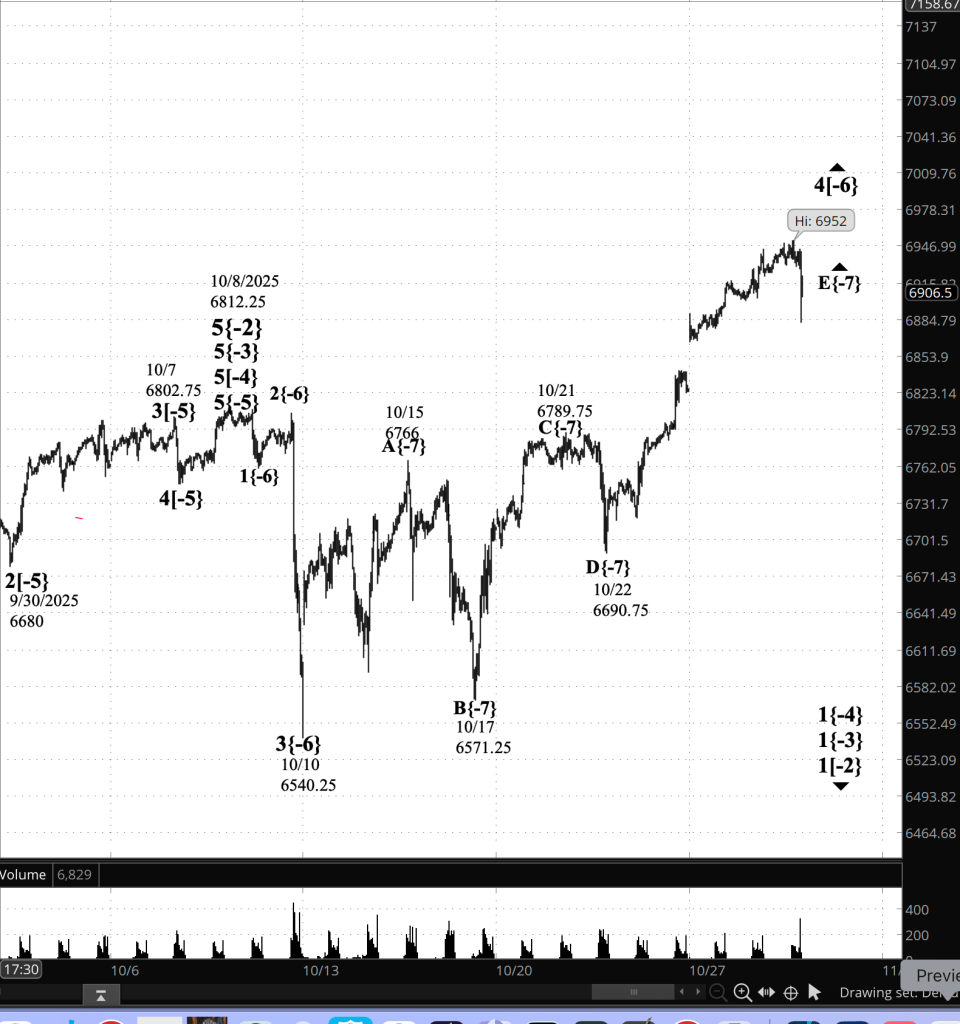
Half an hour before the closing bell. The S&P 500 futures fell from the session peak, 6909.50, down to 6849.50, afterward retracing to the 6890s.
All in all, seen through the lens of Elliott Wave Theory the changes were portions of the 2nd-wave upward correction that began on October 31 within the declining 1st wave downtrend, part the a major downtrending movement, a 5th wave that began on October 30.
9:35 a.m. New York time.
What’s happening now. When trading resumed overnight, the S&P 500 E-mini futures opened in the 6970s, zigzagged higher to 6903, and then fell back a little.
What does it mean? When Elliott Wave Theory analysis is applied, the movement is labeled an 2nd-wave upward correction, wave 2{-8} using the chart nomenclature, where the wave’s degree is stated in curly brackets as number of degrees distant from Intermediate degree. Wave 2{-8} is a subwave of wave 1{-8}, which in turn is a subwave of a downtrending wave 5 that began on October 30.
It’s possible that the wave 1{-7} ended on October 31 and that a rising 2nd wave correction is now underway. However, the principal analysis described above seems more likely to me.
Typically, a 2nd wave will retrace a Fibonacci 61.8% of the preceding 1st wave. If this 2nd wave follows that pattern, then it will end around 6911.60. So the end is near, and wave 2{-8} will be followed by declining wave 3{-8}, which may well carry the price into the 5500s.

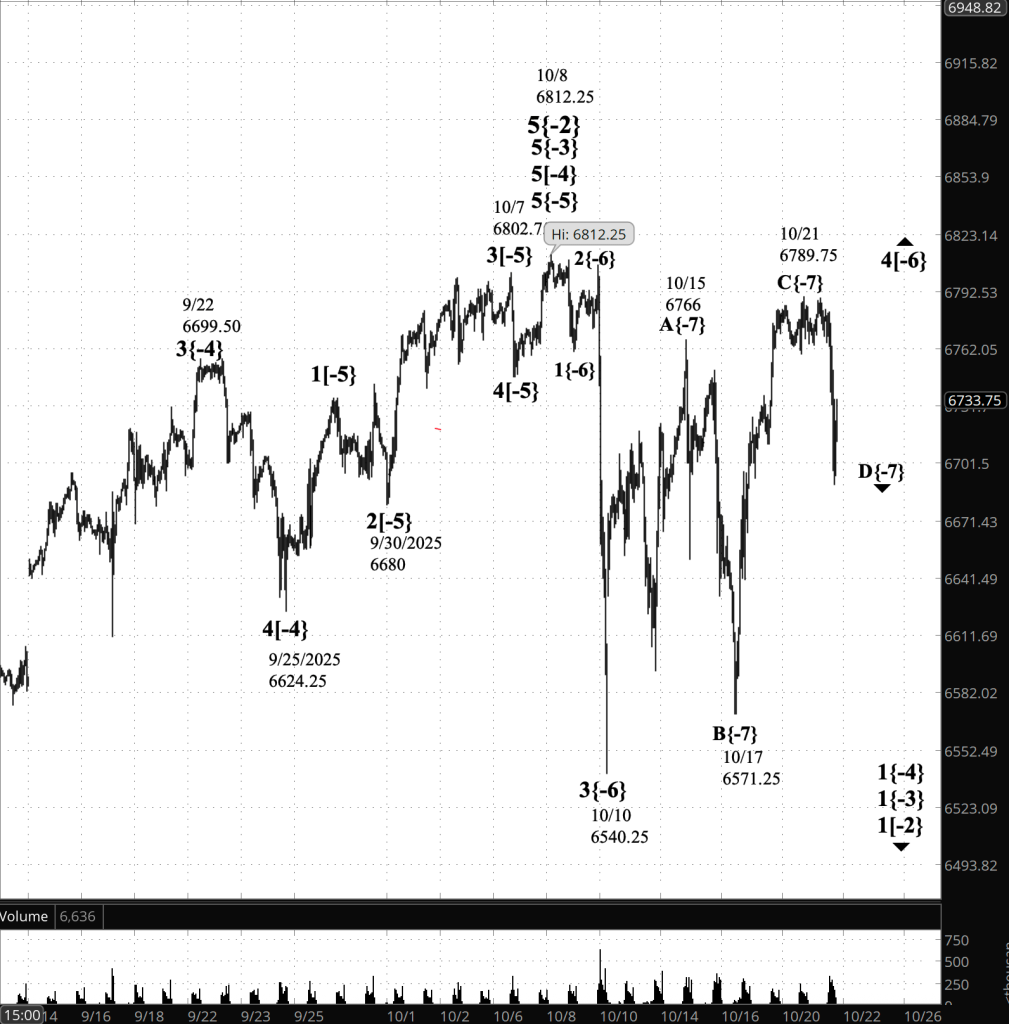
[S&P 500 E-mini futures at 3:30 p.m., 50-minute bars, with volume]
Waves Now Underway
These are the waves currently in progress under my principal analysis. Each line on the list shows the wave number, with the subscript in curly brackets, the traditional degree name, the starting date, the starting price of the S&P 500 E-mini futures, and the direction of the wave.
- 1{+4} Supermillennium, (unknown start date or start price) {down}
- A hypothetical wave one degree higher than Supercyle, needed to make the wave analysis complete.
- S&P 500 Index:
- 1{+3} Supercycle, 10/8/2025, 6812.25 (down}
- 1{+2} Cycle, 10/8/2025, 6812.25 (down}
- 1{+1} Primary, 10/8/2025, 6812.25 (down}
- 1{0} Intermediate, 10/8/2025, 6812.25 (down}
- 1{-1} Minor, 10/8/2025, 6812.25 (down}
- 1{-2} Minute, 10/8/2025, 6812.25 (down}
- S&P 500 Futures
- 1{-3} Minuette 10/8/2025, 6812.25 (down}
- 1{-4} Subminutte 10/8/2025, 6812.25 (down}
- 2{-5} Micro, 10/17/2025, 6571.25 (up}
- 5{-6} Submicro, 10/30/2025, 6853.75 (down)
- 1{-7} Minscule, 10/30/2025, 6853.75 (down)
- 2{-8} (no name), 10/31/2025, 6843.50 (up)
Reading the chart. Price movements — waves – – in Elliott Wave Theory analysis are labeled with numbers within trending waves and letters with corrective waves. The subscripts — numbers in curly brackets — designate the wave’s degree, which, in Elliott Wave analysis, means the relative position of a wave within the larger and smaller structures that make up the chart. R.N. Elliott, who in the 1930s developed the form of analysis that bears his name, viewed the chart as a complex structure of smaller waves nested within larger waves, which in turn are nested within still larger waves. In mathematics it’s called a fractal structure, where at every scale the pattern is similar to the others.
Learning and other resources. Elliott Wave analysis provides context, not prophecy. As the 20th century semanticist Alfred Korzybski put it in his book Science and Sanity (1933), “The map is not the territory … The only usefulness of a map depends on similarity of structure between the empirical world and the map.” And I would add, in the ever-changing markets, we can judge that similarity of structure only after the fact.
See the menu page Analytical Methods for a rundown on where to go for information on Elliott Wave analysis.
By Tim Bovee, Portland, Oregon, November 3, 2025
Disclaimer
Tim Bovee, Private Trader tracks the analysis and trades of a private trader for his own accounts. Nothing in this blog constitutes a recommendation to buy or sell stocks, options or any other financial instrument. The only purpose of this blog is to provide education and entertainment.
No trader is ever 100 percent successful in his or her trades. Trading in the stock and option markets is risky and uncertain. Each trader must make trading decisions for his or her own account, and take responsibility for the consequences.
All content on Tim Bovee, Private Trader by Timothy K. Bovee is licensed under a Creative Commons Attribution-ShareAlike 4.0 International License.
Based on work at www.timbovee.com


You must be logged in to post a comment.