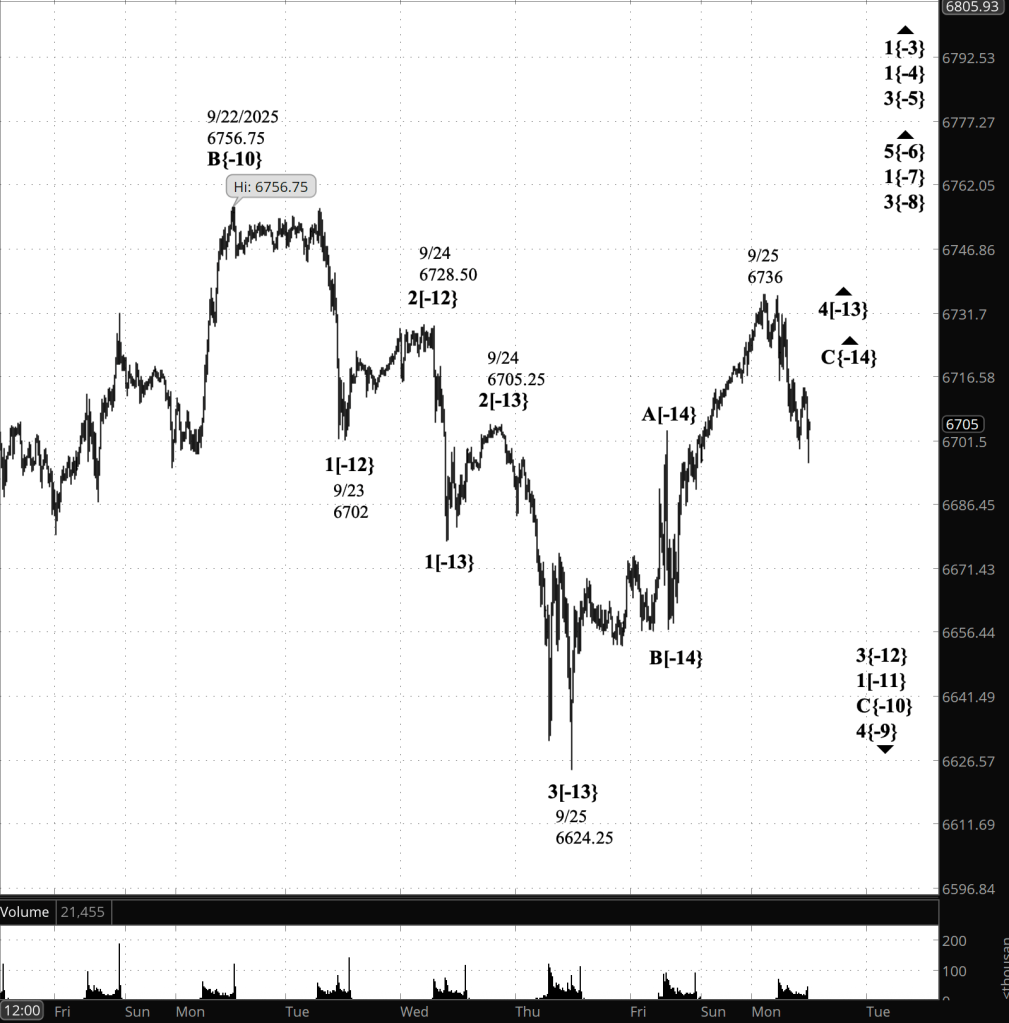
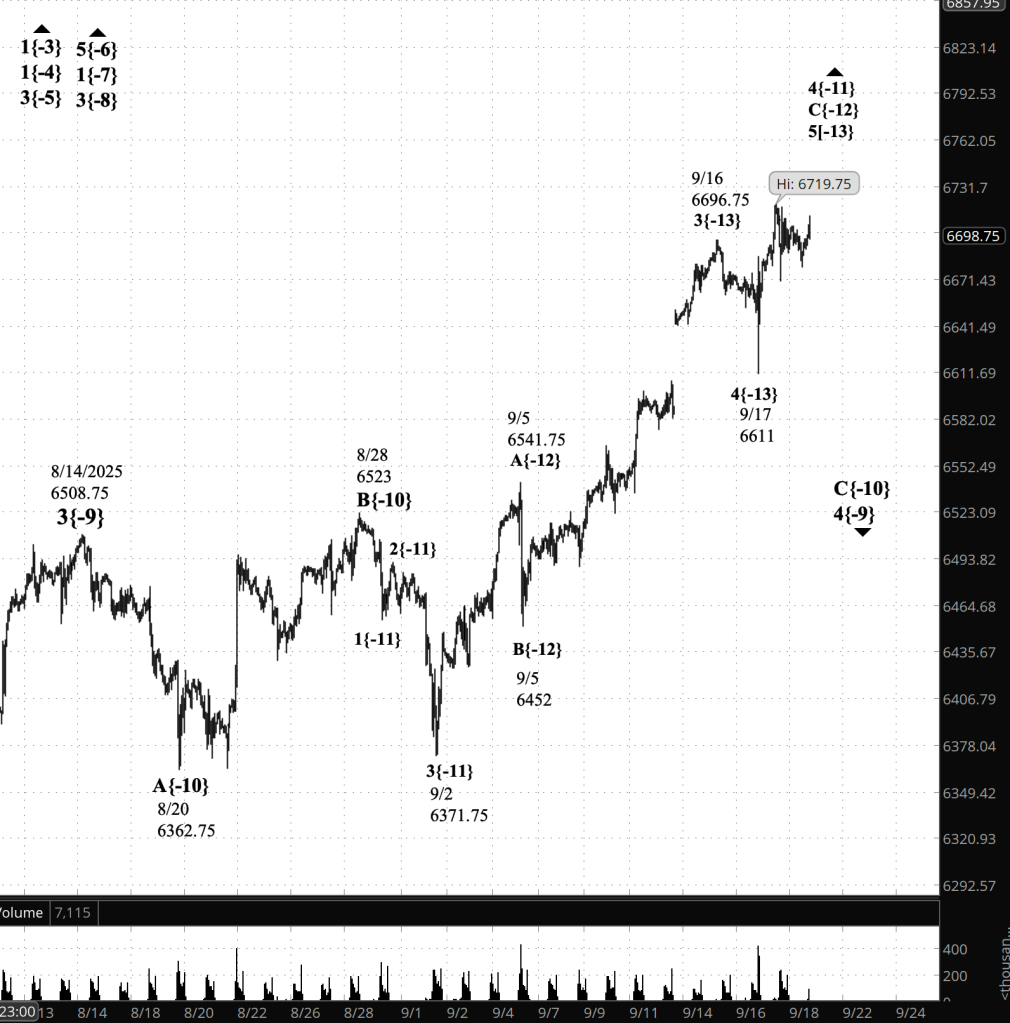
3:30 p.m. New York time
Half an hour before the closing bell. Half an hour before the closing bell, S&P 500 futures recovered into the 6720s after dipping to an earlier session low of 6693. the price rose quickly into the 6730s as the closing bell drew nearer.
Elliott Wave Theory: A downtrendng subwave within the 4th-wave upward correction that began four days ago is now in its final subwave. When the subwave is complete, the parent wave 4 will continue its rise.
Elliott Wave Theory:
- The market remains inside a 4th-wave upward correction that began four days ago.
- Within that structure, today’s action reflects a downtrending subwave now entering its final leg (C{-14}).
- Once this subwave completes, the parent wave 4{-13} should resume its upward movement.
Forward-Looking Markers:
A break and close below 6690 would delay this scenario, suggesting a deeper retest of the 6650 region before wave 4{-13} resumes.
A confirmed completion of C{-14} would project wave 4{-13} upward into the 6745–6775 zone as the next resistance band.
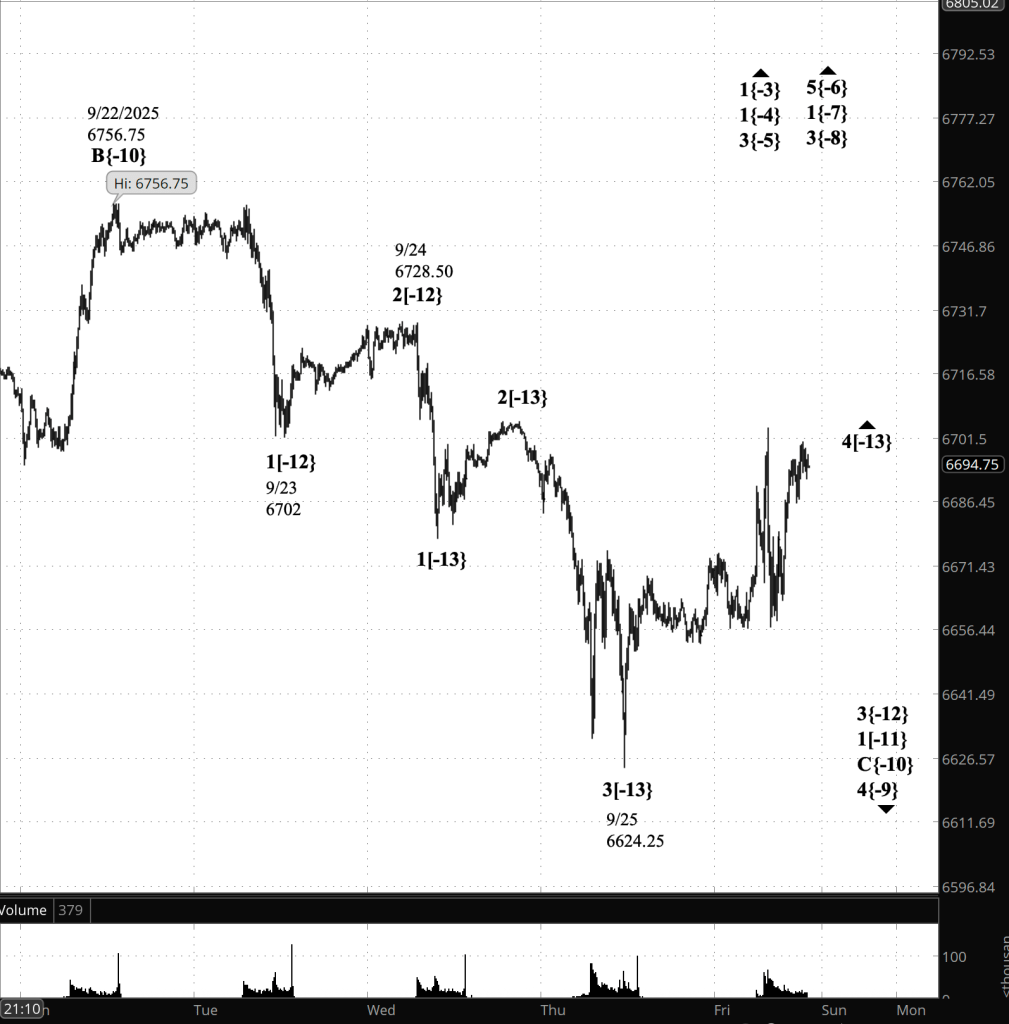
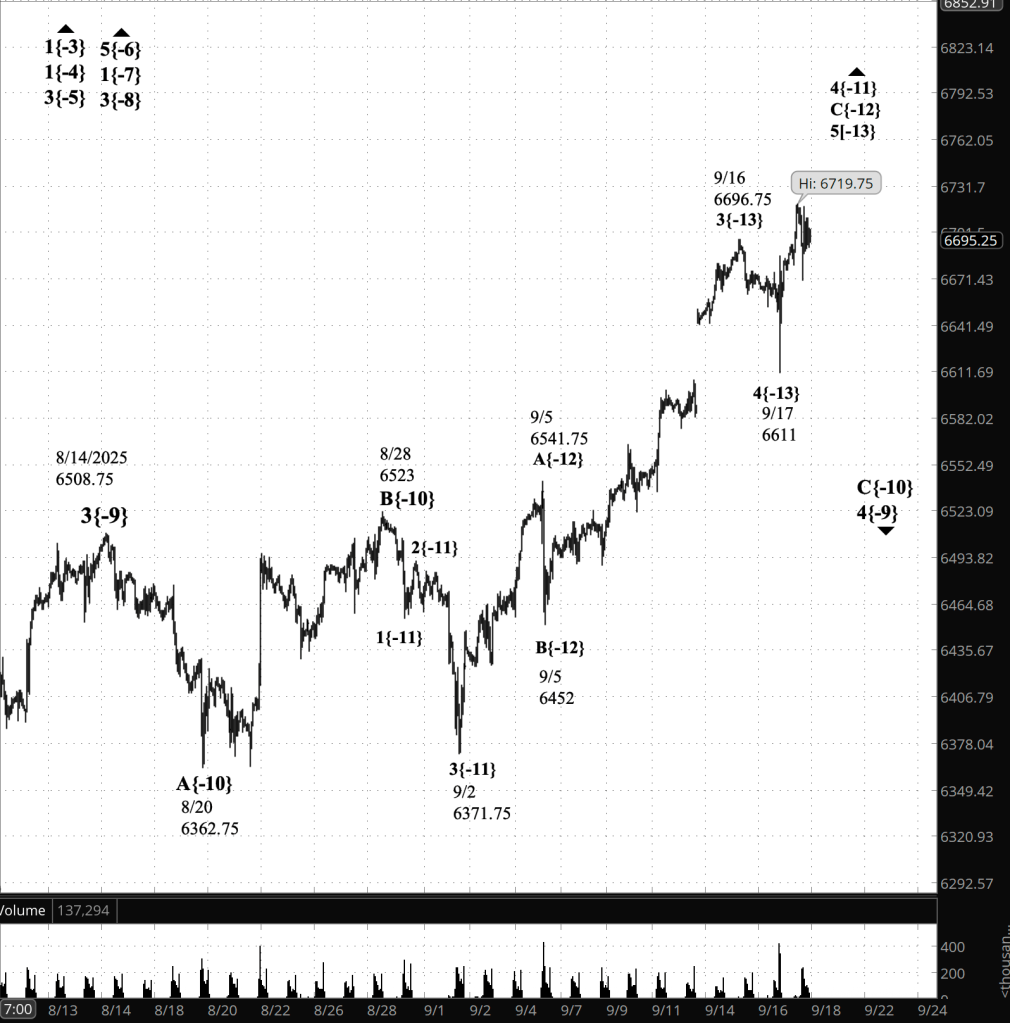
9:35 a.m. New York time.
What’s happening now. The S&P 500 E-mini futures declined to 6694.25 overnight and then rose back into the 6710s as the session’s open approached.
What does it mean? As Elliott Wave Theory sees it, the decline is a subwave within wave C, a subwave of the 4th-wave upward correction that began on September 25. When the present small downard correction is done, wave C within the upward correction will continue its rise.
When wave C is complete, it will be followed by a falling X wave and then a second three-wave corrective patter, making wave 4 a complex correction.

[S&P 500 E-mini futures at 3:30 p.m., 15-minute bars, with volume]
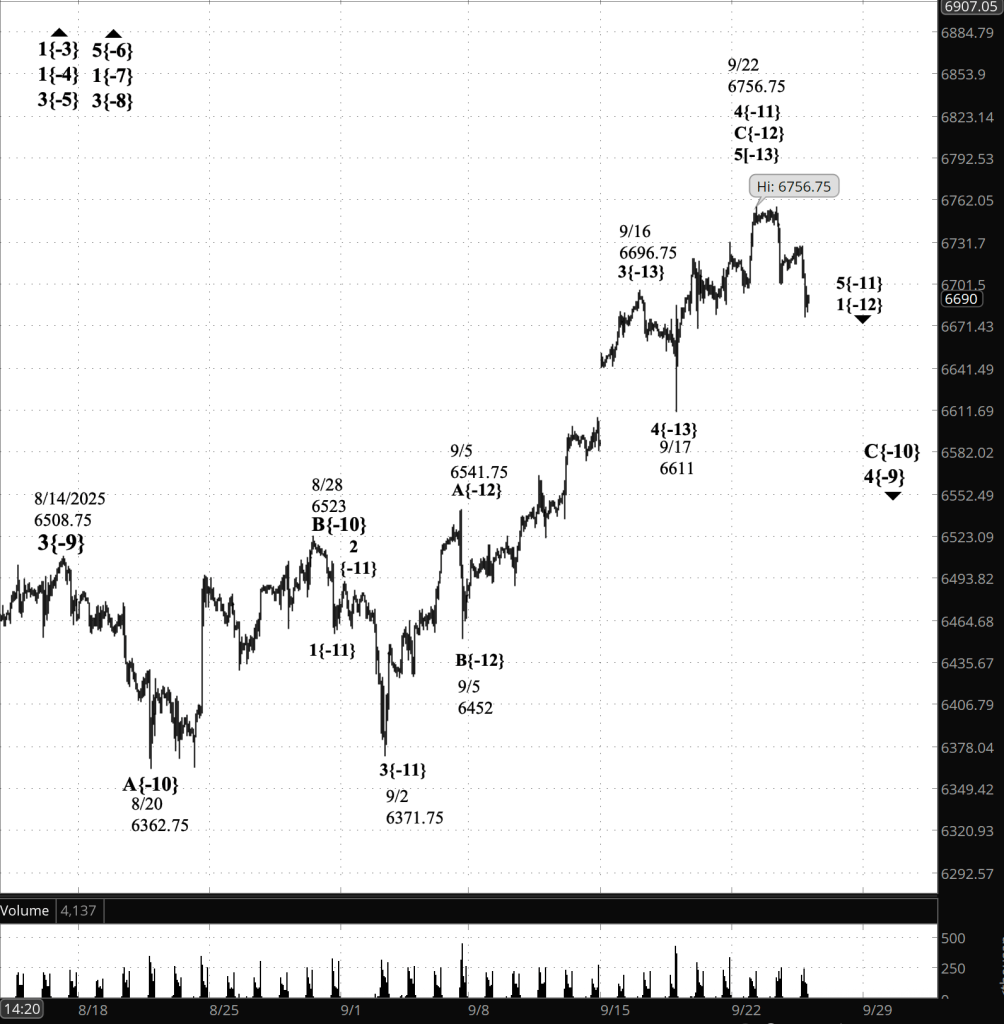
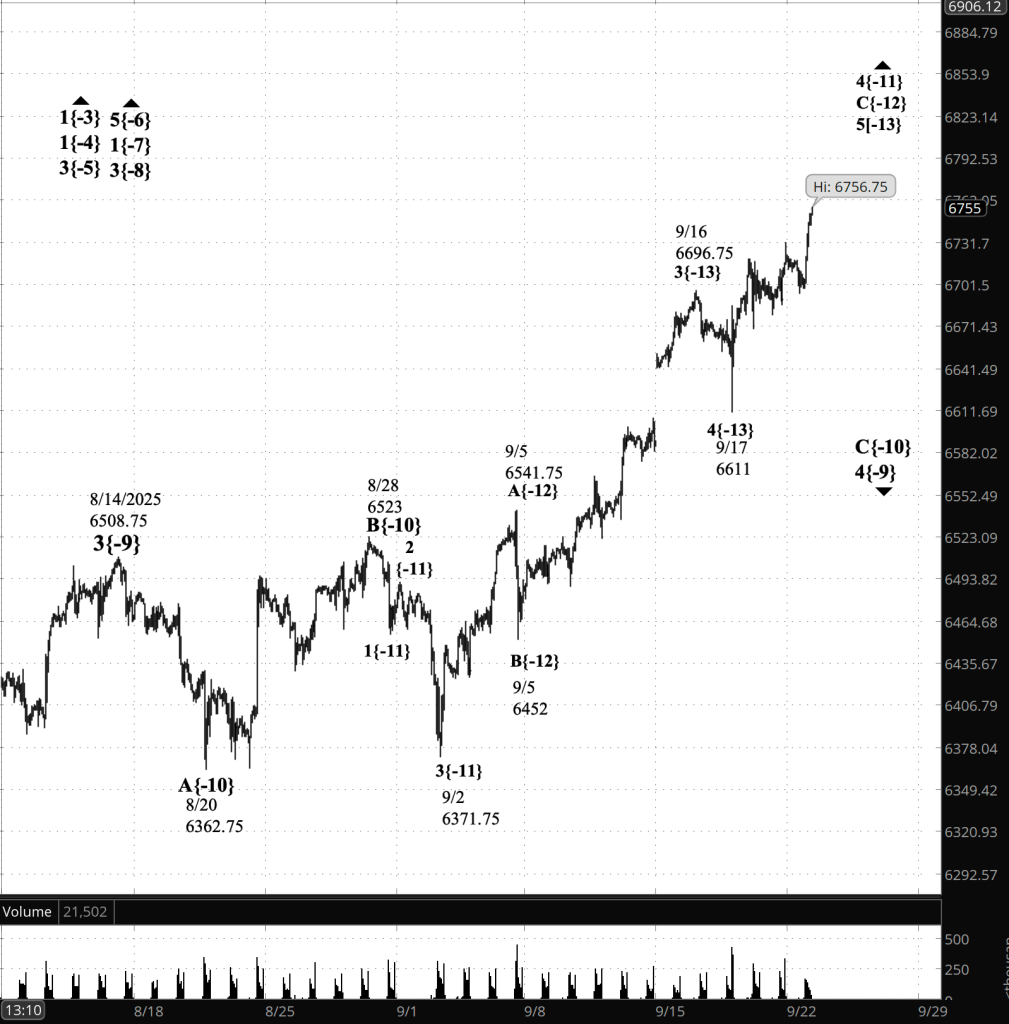
Waves Now Underway
These are the waves currently in progress under my principal analysis. Each line on the list shows the wave number, with the subscript in curly brackets, the traditional degree name, the starting date, the starting price of the S&P 500 E-mini futures, and the direction of the wave.
- S&P 500 Index:
- 5{+3} Supercycle, 7/8/1932, 4.40 (up)
- 5{+2} Cycle, 12/9/1974, 60.96 (up)
- 5{+1} Primary, 3/6/2009, 666.79 (up)
- 5{0} Intermediate, 2/11/2016, 1810.10 (up)
- 3{-1} Minor, 3/23/2020, 2191.36 (up)
- 1{-2} Minute, 7/31/2025, 6468.50 (down)
- S&P 500 Futures
- 1{-3} Minuette, 10/13/2022, 4603 (up)
- 1{-4} Subminuette, 4/7/2025, 4832 (up)
- 3{-5} Micro, 4/21/2025, 5127.25 (up)
- 5{-6} Submicro, 8/1/2025, 6249.50 (up)
- 1{-7} Minuscule, 8/1/2025, 6349.50 (up)
- 3{-8} (unnamed), 8/5/2025, 6313.25 (up)
- 4{-9} (unnamed), 8/14/2025, 6508.75 (down)
- C{-10} (unnamed), 9/22/2025, 6756.75 (down)
- 1{-11} (unnamed), 9/22/2025, 6756.75 (down)
- 3{-12} (unnamed), 9/24/2025, 6728.50 (down)
- 4{-13} (unnamed), 9/25/2025, 6624.25 (up)
- C{-14} (unnamed), 9/25/2025, 6657.25 (up)
Reading the chart. Price movements — waves – – in Elliott Wave Theory analysis are labeled with numbers within trending waves and letters with corrective waves. The subscripts — numbers in curly brackets — designate the wave’s degree, which, in Elliott Wave analysis, means the relative position of a wave within the larger and smaller structures that make up the chart. R.N. Elliott, who in the 1930s developed the form of analysis that bears his name, viewed the chart as a complex structure of smaller waves nested within larger waves, which in turn are nested within still larger waves. In mathematics it’s called a fractal structure, where at every scale the pattern is similar to the others.
Learning and other resources. Elliott Wave analysis provides context, not prophecy. As the 20th century semanticist Alfred Korzybski put it in his book Science and Sanity (1933), “The map is not the territory … The only usefulness of a map depends on similarity of structure between the empirical world and the map.” And I would add, in the ever-changing markets, we can judge that similarity of structure only after the fact.
See the menu page Analytical Methods for a rundown on where to go for information on Elliott Wave analysis.
By Tim Bovee, Portland, Oregon, September 30 , 2025
Disclaimer
Tim Bovee, Private Trader tracks the analysis and trades of a private trader for his own accounts. Nothing in this blog constitutes a recommendation to buy or sell stocks, options or any other financial instrument. The only purpose of this blog is to provide education and entertainment.
No trader is ever 100 percent successful in his or her trades. Trading in the stock and option markets is risky and uncertain. Each trader must make trading decisions for his or her own account, and take responsibility for the consequences.
All content on Tim Bovee, Private Trader by Timothy K. Bovee is licensed under a Creative Commons Attribution-ShareAlike 4.0 International License.
Based on work at www.timbovee.com


You must be logged in to post a comment.