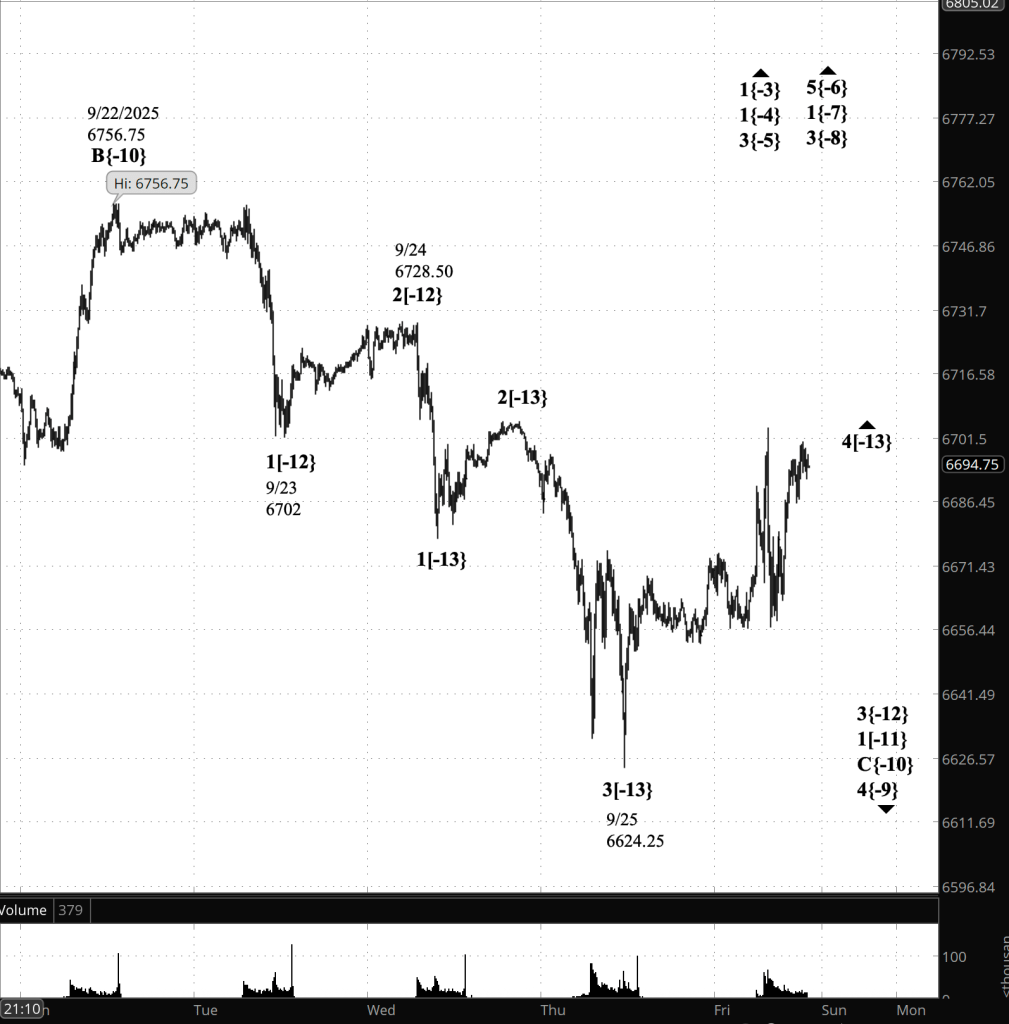
3:30 p.m. New York time.
Half an hour before the closing bell. The S&P 500 futures turned from the high, 6802.75, and rapidly declined into the 6740s.
Elliott Wave Theory: The ground covered by the decline has persuaded me that wave C{-14} ended at the peak and wave X{-14} is now underway. An X wave connects two three-wave corrective patterns (built of waves A, B and C waves) in a complex correction. This 4th wave is taking a complex form. We know this because wave C carried the price well above it’s maximum under the rules of Elliott Wave Theory. That broke a rule. But in a complex correction, the rule isn’t broken.
As always when a stock turns on a dime, it’s possible that it’s a head fake, that it will whip around and wipe out the old high with a new one. Should that happen, then we’re back to wave C with wave 4, blushing slightly.
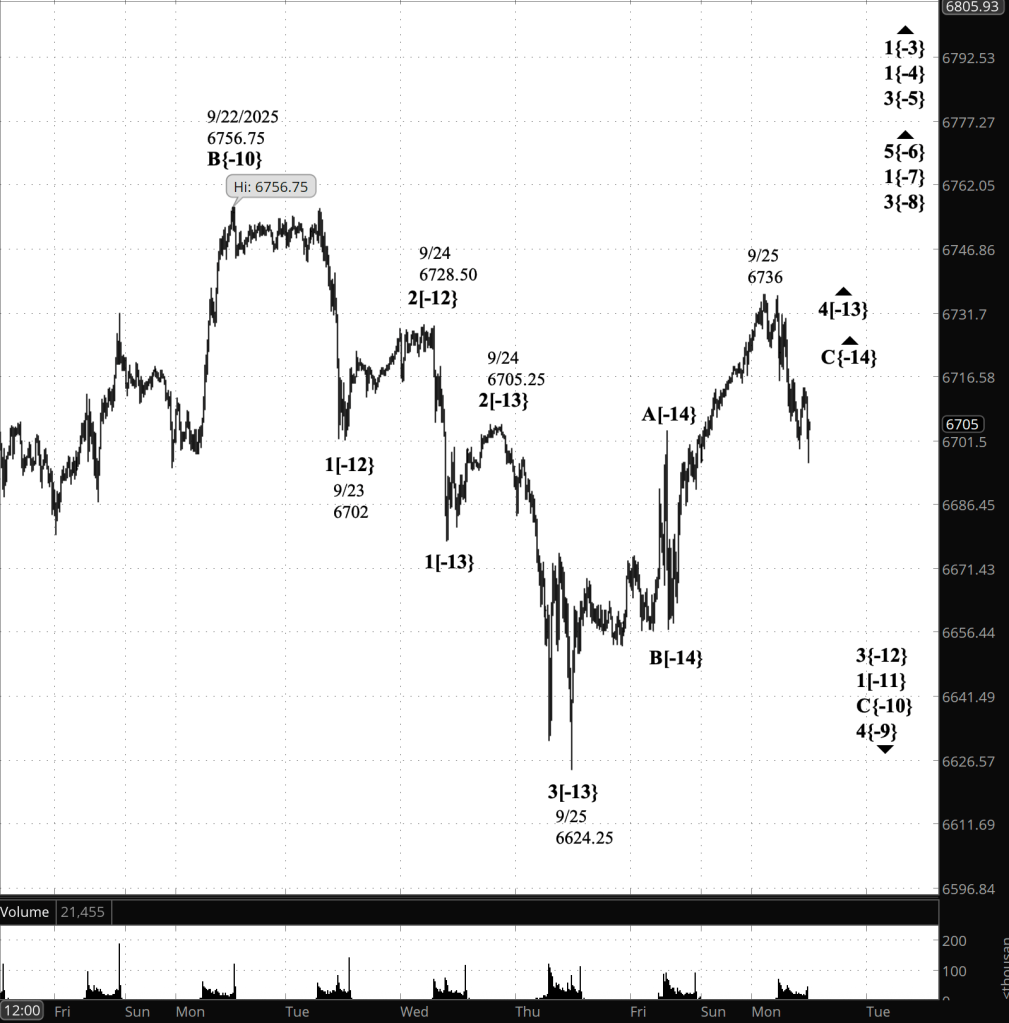
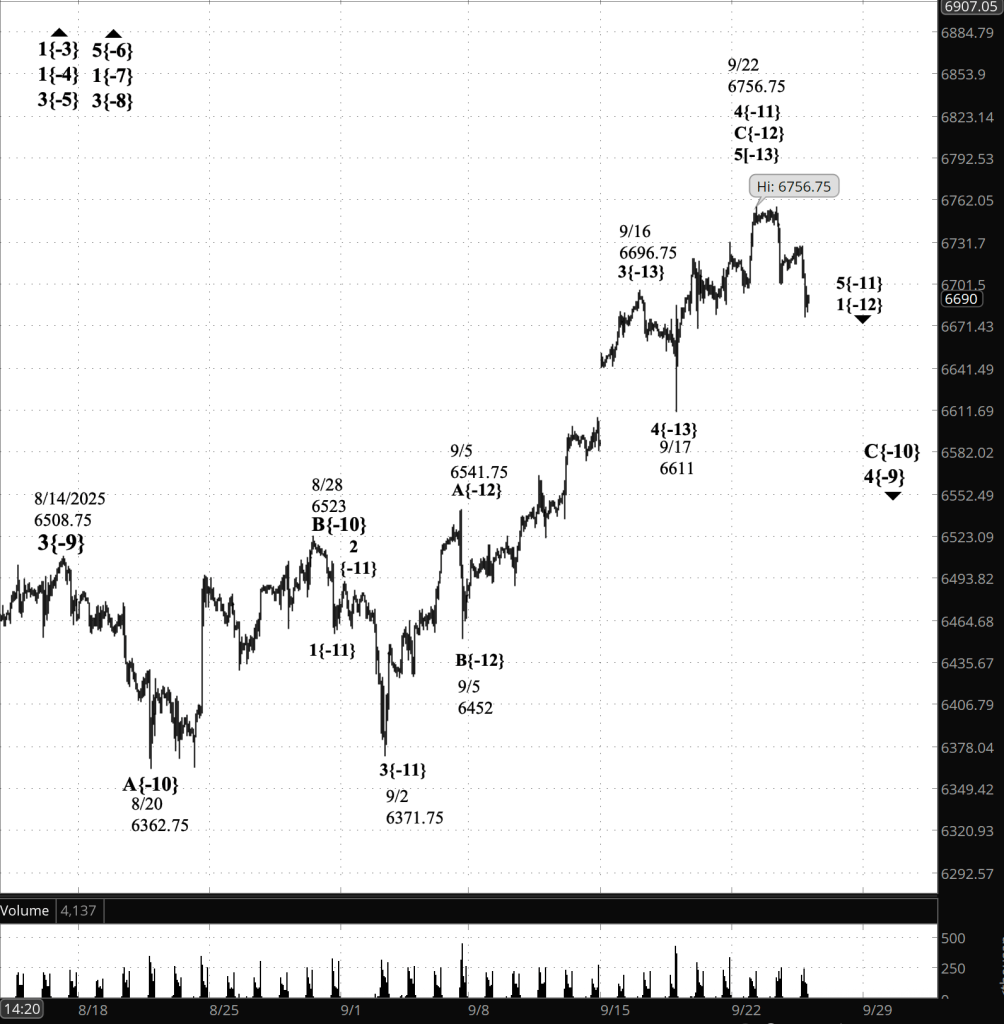
9:35 a.m. New York time.
What’s happening now. The S&P 500 E-mini futures rose to a higher all-time high, 6802.75, as the opening bell approached.
What does it mean? The new high, when Elliott Wave Theory analysis is applied, clarifies the wave structure on the chart. Rising wave C, which began on September 30, is still underway with the 4th-wave upward correction that began on September 25.
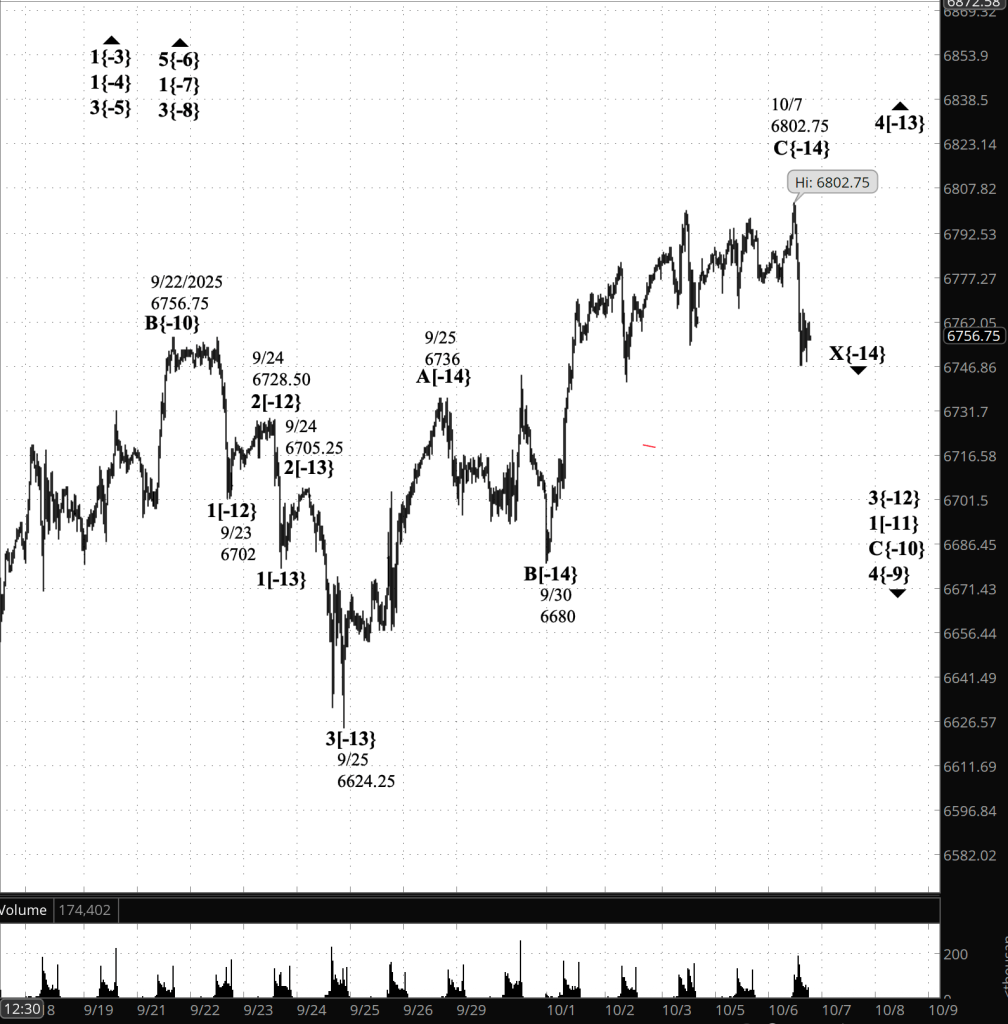
[S&P 500 E-mini futures at 3:30 p.m., 30-minute bars, with volume]
Waves Now Underway
These are the waves currently in progress under my principal analysis. Each line on the list shows the wave number, with the subscript in curly brackets, the traditional degree name, the starting date, the starting price of the S&P 500 E-mini futures, and the direction of the wave.
- S&P 500 Index:
- 5{+3} Supercycle, 7/8/1932, 4.40 (up)
- 5{+2} Cycle, 12/9/1974, 60.96 (up)
- 5{+1} Primary, 3/6/2009, 666.79 (up)
- 5{0} Intermediate, 2/11/2016, 1810.10 (up)
- 3{-1} Minor, 3/23/2020, 2191.36 (up)
- 1{-2} Minute, 7/31/2025, 6468.50 (down)
- S&P 500 Futures
- 1{-3} Minuette, 10/13/2022, 4603 (up)
- 1{-4} Subminuette, 4/7/2025, 4832 (up)
- 3{-5} Micro, 4/21/2025, 5127.25 (up)
- 5{-6} Submicro, 8/1/2025, 6249.50 (up)
- 1{-7} Minuscule, 8/1/2025, 6349.50 (up)
- 3{-8} (unnamed), 8/5/2025, 6313.25 (up)
- 4{-9} (unnamed), 8/14/2025, 6508.75 (down)
- C{-10} (unnamed), 9/22/2025, 6756.75 (down)
- 1{-11} (unnamed), 9/22/2025, 6756.75 (down)
- 3{-12} (unnamed), 9/24/2025, 6728.50 (down)
- 4{-13} (unnamed), 9/25/2025, 6624.25 (up)
- X{-14} (unnamed), 10/7/2025, 6802.75 (down)
Reading the chart. Price movements — waves – – in Elliott Wave Theory analysis are labeled with numbers within trending waves and letters with corrective waves. The subscripts — numbers in curly brackets — designate the wave’s degree, which, in Elliott Wave analysis, means the relative position of a wave within the larger and smaller structures that make up the chart. R.N. Elliott, who in the 1930s developed the form of analysis that bears his name, viewed the chart as a complex structure of smaller waves nested within larger waves, which in turn are nested within still larger waves. In mathematics it’s called a fractal structure, where at every scale the pattern is similar to the others.
Learning and other resources. Elliott Wave analysis provides context, not prophecy. As the 20th century semanticist Alfred Korzybski put it in his book Science and Sanity (1933), “The map is not the territory … The only usefulness of a map depends on similarity of structure between the empirical world and the map.” And I would add, in the ever-changing markets, we can judge that similarity of structure only after the fact.
See the menu page Analytical Methods for a rundown on where to go for information on Elliott Wave analysis.
By Tim Bovee, Portland, Oregon, October 7, 2025
Disclaimer
Tim Bovee, Private Trader tracks the analysis and trades of a private trader for his own accounts. Nothing in this blog constitutes a recommendation to buy or sell stocks, options or any other financial instrument. The only purpose of this blog is to provide education and entertainment.
No trader is ever 100 percent successful in his or her trades. Trading in the stock and option markets is risky and uncertain. Each trader must make trading decisions for his or her own account, and take responsibility for the consequences.
All content on Tim Bovee, Private Trader by Timothy K. Bovee is licensed under a Creative Commons Attribution-ShareAlike 4.0 International License.
Based on work at www.timbovee.com


You must be logged in to post a comment.