3:30 p.m. New York time
Half an hour before the closing bell. The S&P 500 futures fluctuated sideways during the session, bouncing between the 6450s and the 6470s.
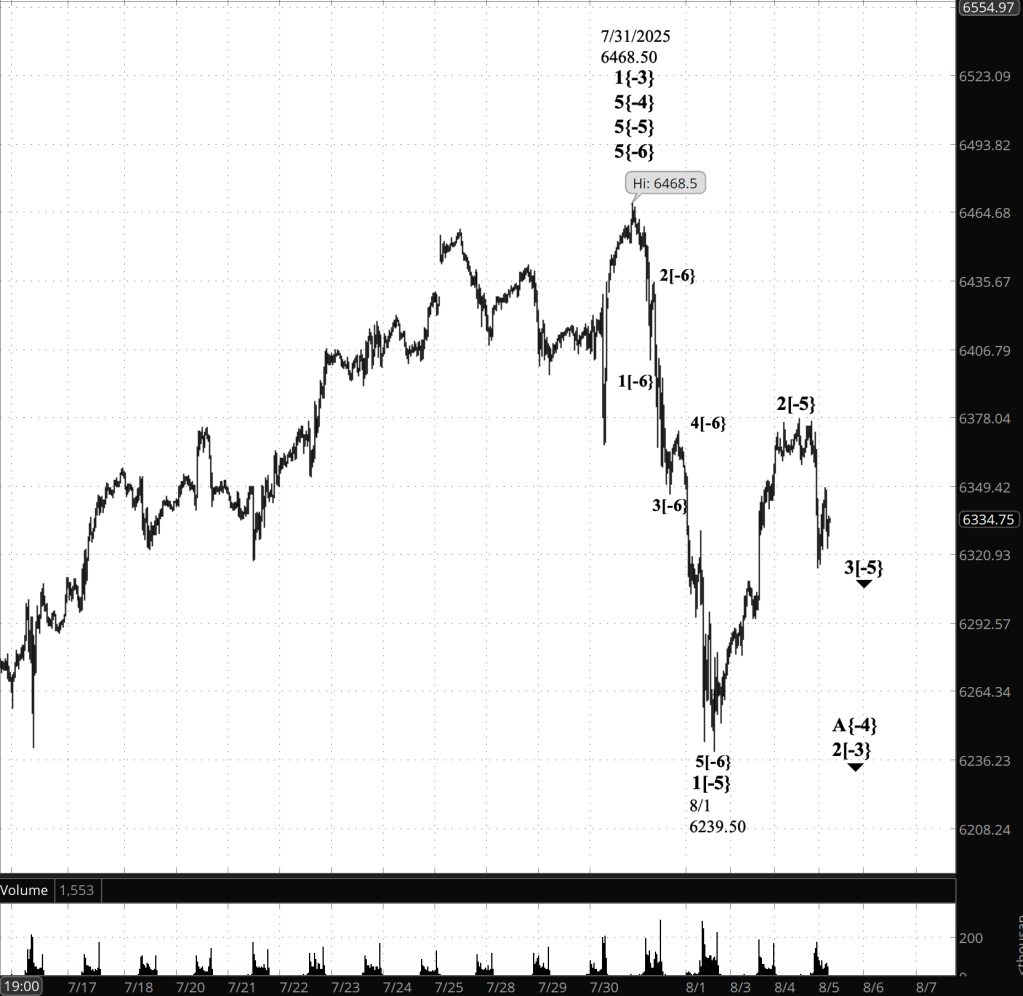
Elliott Wave Theory: This morning’s analysis discussed a lack of clarity: Was wave A underway or wave C?. The present rise in a choppy fashion suggests that it was wave A. So the new choice: Is the choppiness a subwave of wave A, such as a 4th-wave correction, or has wave A ended and wave B, still choppy, begun? A puzzle to be studied overnight and tomorrow.
9:35 a.m. New York time.
What’s happening now. S&P 500 E-mini futures fell into the 6450s in a lackadaisical start tot he week.
What does it mean? Elliott Wave Theory sees the decline as being a 4th-wave downward correction that began last week, on August 14. It is a subwave of a rising 3rd wave that began on August 7, which in turn is a rising 1st wave within an uptrendng 5th wave that began on August 1.
The smallest of the waves listed, the 4th, appears to be in its 3rd subwave, the C wave, although it may well be the 3rd wave of the A wave, with two more subwaves lying ahead.
If its wave C, then a 4th wave correction is almost complete. If its wave A, there is more correction, risng waves B and falling wave C, that lie ahead.
Wave 4 will be followed by an uptrendng 5th wave, and how high wave 5 will go depends, roughly, on how low wave 4 has gone when it is complete.
Whichever scenario wave 4 follows,, wave 5 will likely end in the upper 6500s or the lower 6600s, based on Fibonacci resistance.
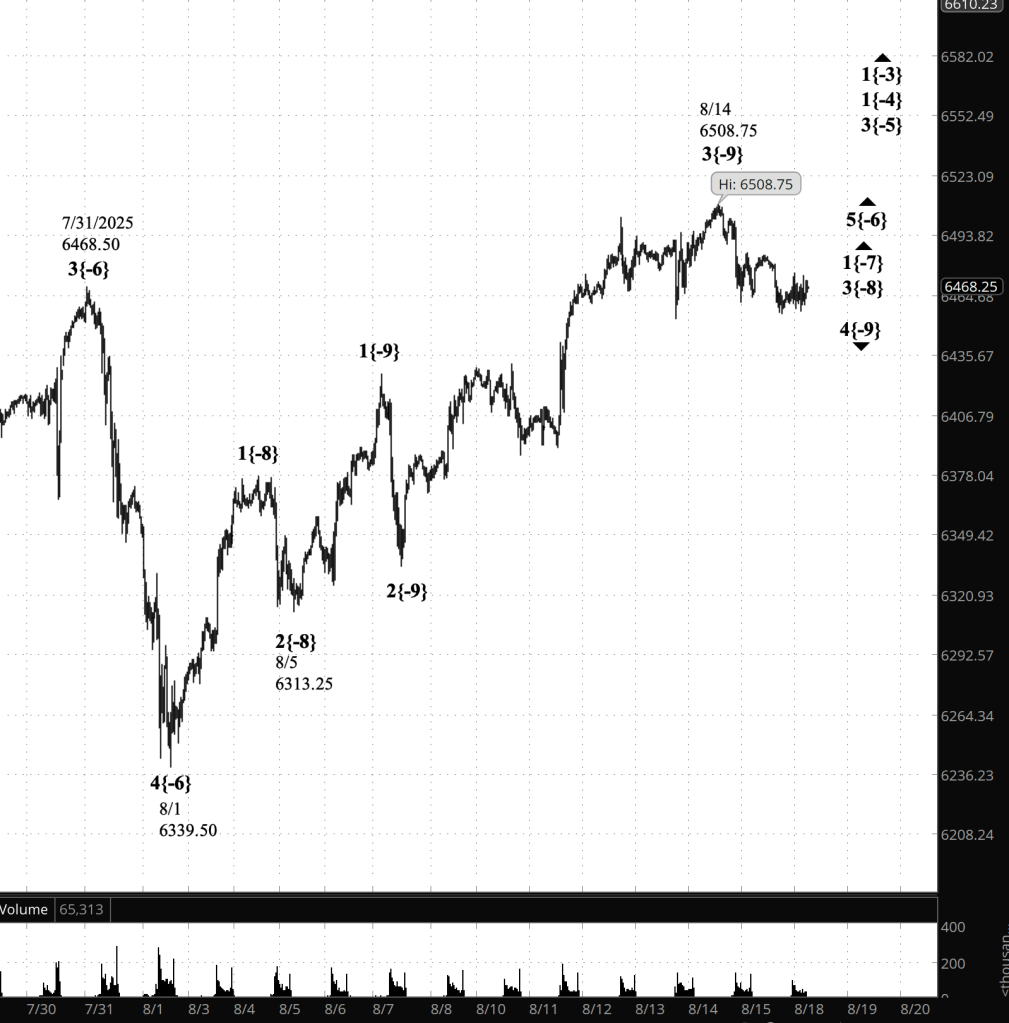
[S&P 500 E-mini futures at 3:30 p.m., 30-minute bars, with volume]
Waves Now Underway
These are the waves currently in progress under my principal analysis. Each line on the list shows the wave number, with the subscript in curly brackets, the traditional degree name, the starting date, the starting price of the S&P 500 E-mini futures, and the direction of the wave.
- S&P 500 Index:
- 5{+3} Supercycle, 7/8/1932, 4.40 (up)
- 5{+2} Cycle, 12/9/1974, 60.96 (up)
- 5{+1} Primary, 3/6/2009, 666.79 (up)
- 5{0} Intermediate, 2/11/2016, 1810.10 (up)
- 3{-1} Minor, 3/23/2020, 2191.36 (up)
- 1{-2} Minute, 7/31/2025, 6468.50 (down)
- S&P 500 Futures
- 1{-3} Minuette, 10/13/2022, 4603 (up)
- 1{-4} Subminuette, 4/7/2025, 4832 (up)
- 3{-5} Micro, 4/21/2025, 5127.25 (up)
- 5{-6} Submicro, 8/1/2025, 6249.50 (up)
- 1{-7} Minuscule, 8/1/2025, 6349.50 (up)
- 3{-8} (unnamed), 8/5/2025, 6313.25 (up)
- 4{-9} (unnamed), 8/14/2025, 6508.75
Reading the chart. Price movements — waves – – in Elliott Wave Theory analysis are labeled with numbers within trending waves and letters with corrective waves. The subscripts — numbers in curly brackets — designate the wave’s degree, which, in Elliott Wave analysis, means the relative position of a wave within the larger and smaller structures that make up the chart. R.N. Elliott, who in the 1930s developed the form of analysis that bears his name, viewed the chart as a complex structure of smaller waves nested within larger waves, which in turn are nested within still larger waves. In mathematics it’s called a fractal structure, where at every scale the pattern is similar to the others.
Learning and other resources. Elliott Wave analysis provides context, not prophecy. As the 20th century semanticist Alfred Korzybski put it in his book Science and Sanity (1933), “The map is not the territory … The only usefulness of a map depends on similarity of structure between the empirical world and the map.” And I would add, in the ever-changing markets, we can judge that similarity of structure only after the fact.
See the menu page Analytical Methods for a rundown on where to go for information on Elliott Wave analysis.
By Tim Bovee, Portland, Oregon, August 18, 2025
Disclaimer
Tim Bovee, Private Trader tracks the analysis and trades of a private trader for his own accounts. Nothing in this blog constitutes a recommendation to buy or sell stocks, options or any other financial instrument. The only purpose of this blog is to provide education and entertainment.
No trader is ever 100 percent successful in his or her trades. Trading in the stock and option markets is risky and uncertain. Each trader must make trading decisions for his or her own account, and take responsibility for the consequences.
All content on Tim Bovee, Private Trader by Timothy K. Bovee is licensed under a Creative Commons Attribution-ShareAlike 4.0 International License.
Based on a work at www.timbovee.com


You must be logged in to post a comment.