3:30 p.m. New York time
More on the chart. The process of eliminating the rule violations brought me back to October 13, 2022, the beginning of wave 3{-2}, making end-point/beginnng-point changes where needed. The goal was to have wave 1{-3} end at the July 31 peak, less than a week ago. That outcome best matched the structure of numerous waves.
On a previous day I mentioned the problem with labeling a new wave early in its journey. Settng the degree of the wave is a guess. Only later is there some clarity, and by then both I and other Elliott Wave analysts I know are deeply involved with the lower-degree details. I took the opportunity to clean out the proliferation of ever smaller waves, and the chart gained in clarity.
But the risk remains. What I’ve numbered as wave 1{-5} within wave A{-4} could well be wave 1{-6} within wave 1{-5} within wave A{-4}. So it begins, and there is no way whatsoever that can be certain which degree is correct. I find it to be the most irritating part of Elliott Wave Theory.
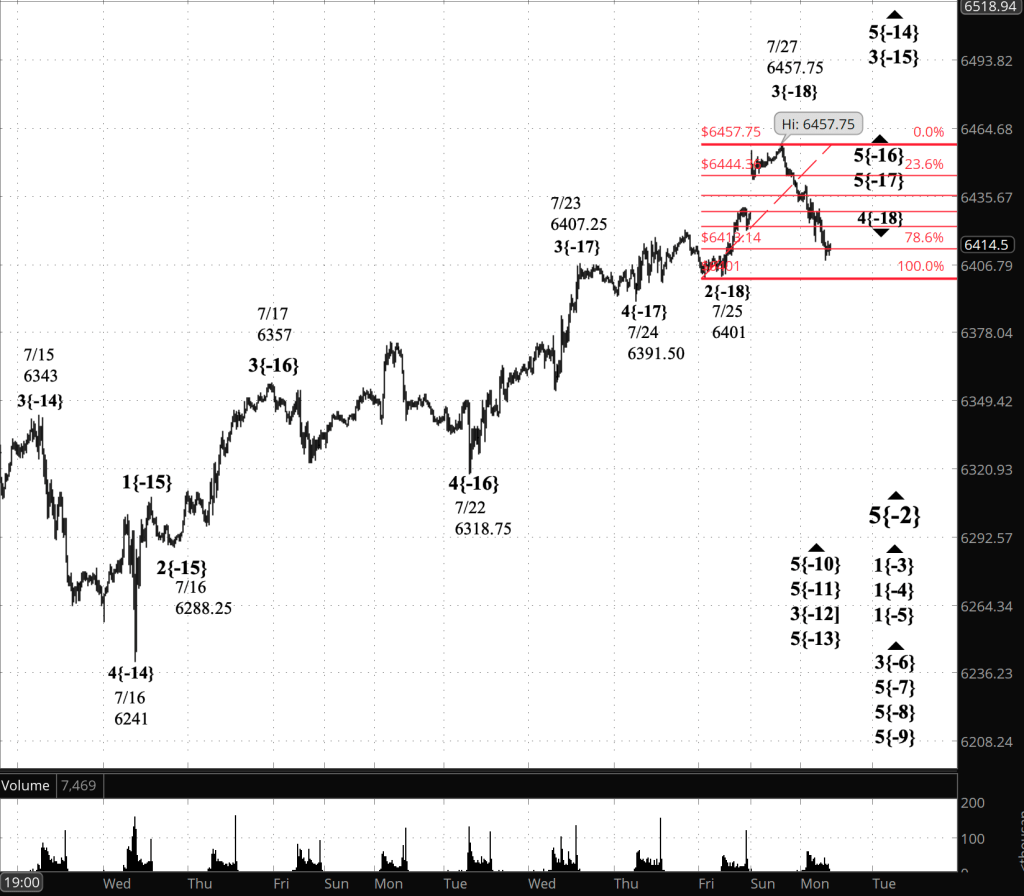
I’ve added a Fibonacci retracement ladder to the close-up chart, below. It shows wave 2{-5} as having stalled at the 50% retracement level.
Half an hour before the closing bell. The S&P 500 futures continued to rise, without the dramatic urgency of the preceding decline, reaching into the 6340s.
9:35 a.m. New York time.
Why has the chart changed? Last week several Elliott Wave Theory rules were broken, and I reached back to reanalyze the labeling in order to solve that problem. The chart posted today reflects those changes.
What’s happening now. The S&P 500 E-mini futures rose slightly as trading resumed overnight, reaching the 6410s from a low of 6233.50.
What does it mean? In my Elliott Wave Theory analysis I’ve labeled wave A{-4} within wave 2{-3} as being underway. The decline is fairly short compared to wave has occured before. I don’t see how wave 2 can be complete. The same goes for wave A, the first subwave of wave A.
So my principal analysis is that wave A continues, having competed its 1st subwave, declining wave 1{-5}. the overnight rise is rising wave 2{-5}, a rising correction within wave A.
Two charts…
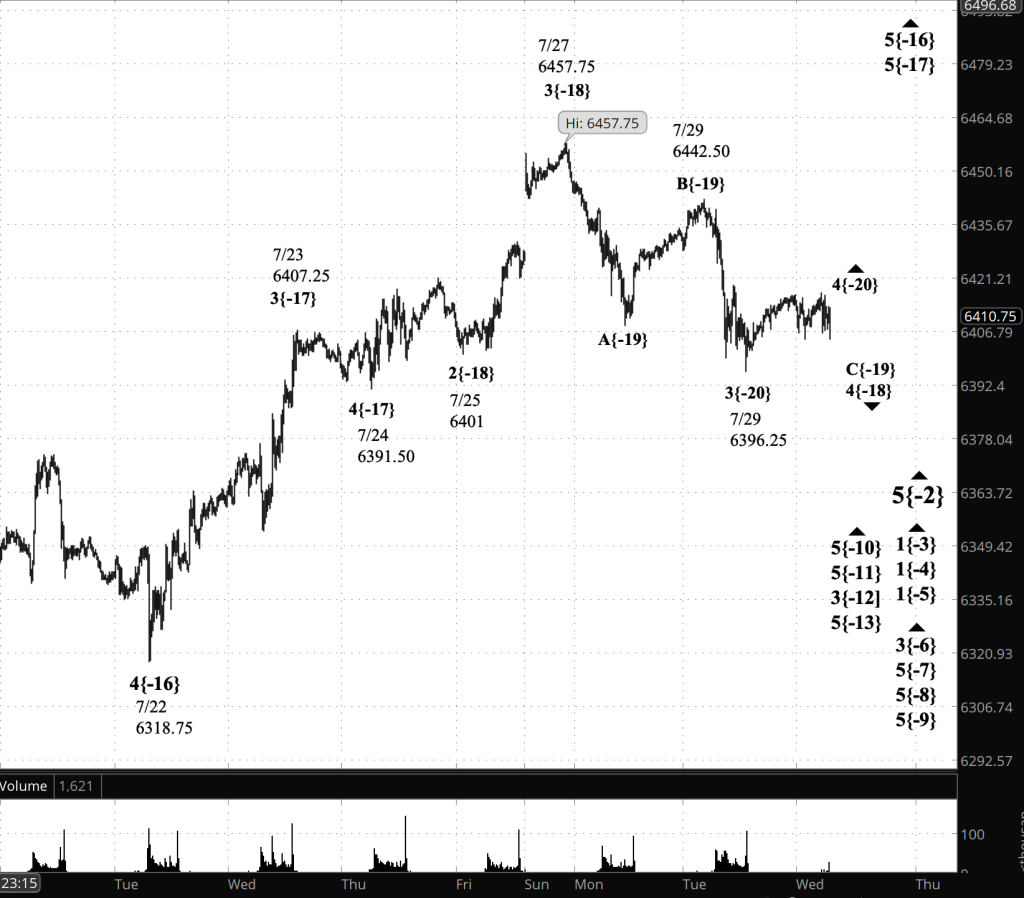
The Big Picture:

[S&P 500 E-mini futures at 3:30 p.m., 5-hour bars, with volume]
A Close-up:

[S&P 500 E-mini futures at 3:30.m., 10-minute bars, with volume]
Reading the chart. Price movements — waves – – in Elliott Wave Theory analysis are labeled with numbers within trending waves and letters with corrective waves. The subscripts — numbers in curly brackets — designate the wave’s degree, which, in Elliott Wave analysis, means the relative position of a wave within the larger and smaller structures that make up the chart. R.N. Elliott, who in the 1930s developed the form of analysis that bears his name, viewed the chart as a complex structure of smaller waves nested within larger waves, which in turn are nested within still larger waves. In mathematics it’s called a fractal structure, where at every scale the pattern is similar to the others.
Learning and other resources. Elliott Wave analysis provides context, not prophecy. As the 20th century semanticist Alfred Korzybski put it in his book Science and Sanity (1933), “The map is not the territory … The only usefulness of a map depends on similarity of structure between the empirical world and the map.” And I would add, in the ever-changing markets, we can judge that similarity of structure only after the fact.
See the menu page Analytical Methods for a rundown on where to go for information on Elliott Wave analysis.
By Tim Bovee, Portland, Oregon, August 4, 2025
Disclaimer
Tim Bovee, Private Trader tracks the analysis and trades of a private trader for his own accounts. Nothing in this blog constitutes a recommendation to buy or sell stocks, options or any other financial instrument. The only purpose of this blog is to provide education and entertainment.
No trader is ever 100 percent successful in his or her trades. Trading in the stock and option markets is risky and uncertain. Each trader must make trading decisions for his or her own account, and take responsibility for the consequences.
All content on Tim Bovee, Private Trader by Timothy K. Bovee is licensed under a Creative Commons Attribution-ShareAlike 4.0 International License.
Based on a work at www.timbovee.com.


You must be logged in to post a comment.