3:30 a.m. New York time
Half an hour before the losing bell. The S&P 500 futures barely budged during the session, remaining in the 6480s after peaking at 6502.50 the day before.
Elliott Wave Theory: The uptrending 3rd wave that began April 21 continues on its final subwave, wave 5. That 5th wave, in turn, appears to be in its 5h wave, although the wave divisions lack clarity at that degree.
9:35 a.m. New York time.
What’s happening now. Overnight, the S&P 500 E-mini futures remained slightly below the August 13 peak, 6502.50, until an hour before the opening bell, when it fell sharply down to the 6450s. The declne coincided with the releasse of two economic reports, the weekly Initial Jobless Claims, and the Producer Price Index.
What does it mean? Elliott Wave Theory sees the decline meaning little. It is a small step back within an uptrendng 5th-wave that began on August 1.
In terms of wave numnrs and their degrees relative to Intermediate degree, the overnight decline is a subwave within risng wve 3{-8} within risng wav 1{-7} within rising wave 5{-6}, the smallest of a 3-degree grouping.
Minuscule indeed.

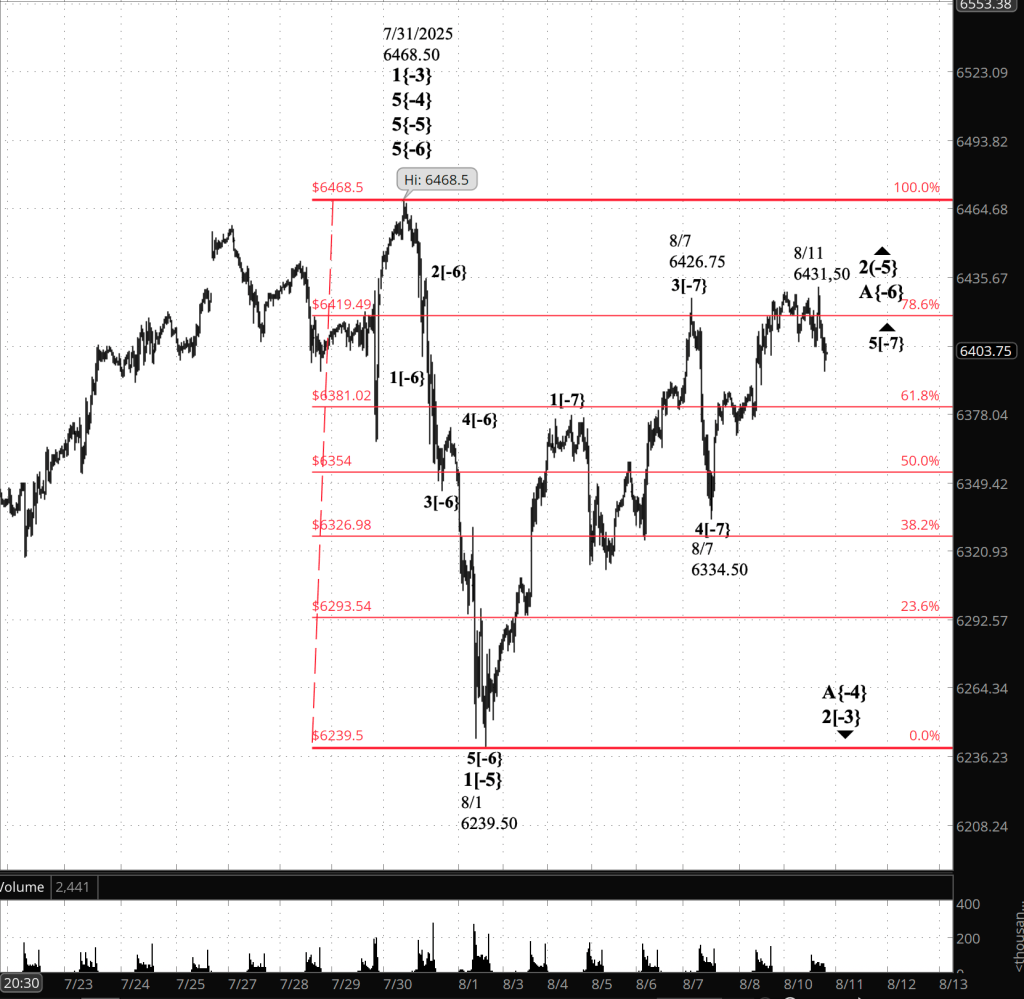
[S&P 500 E-mini futures at 3:30 p.m., 4-hour bars, with volume]
Waves Now Underway
These are the waves currently in progress under my principal analysis. Each line on the list shows the wave number, with the subscript in curly brackets, the traditional degree name, the starting date, the starting price of the S&P 500 E-mini futures, and the direction of the wave.
- S&P 500 Index:
- 5{+3} Supercycle, 7/8/1932, 4.40 (up)
- 5{+2} Cycle, 12/9/1974, 60.96 (up)
- 5{+1} Primary, 3/6/2009, 666.79 (up)
- 5{0} Intermediate, 2/11/2016, 1810.10 (up)
- 3{-1} Minor, 3/23/2020, 2191.36 (up)
- 1{-2} Minute, 7/31/2025, 6468.50 (down)
- S&P 500 Futures
- 1{-3} Minuette, 10/13/2022, 4603 (up)
- 1{-4} Subminuette, 4/7/2025, 4832 (up)
- 3{-5} Micro, 4/21/2025, 5127.25 (up)
- 5{-6} Submicro, 8/1/2025, 6349.50 (up)
- 1{-7} Minuscule, 8/1/2025, 6349.50 (up)
Reading the chart. Price movements — waves – – in Elliott Wave Theory analysis are labeled with numbers within trending waves and letters with corrective waves. The subscripts — numbers in curly brackets — designate the wave’s degree, which, in Elliott Wave analysis, means the relative position of a wave within the larger and smaller structures that make up the chart. R.N. Elliott, who in the 1930s developed the form of analysis that bears his name, viewed the chart as a complex structure of smaller waves nested within larger waves, which in turn are nested within still larger waves. In mathematics it’s called a fractal structure, where at every scale the pattern is similar to the others.
Learning and other resources. Elliott Wave analysis provides context, not prophecy. As the 20th century semanticist Alfred Korzybski put it in his book Science and Sanity (1933), “The map is not the territory … The only usefulness of a map depends on similarity of structure between the empirical world and the map.” And I would add, in the ever-changing markets, we can judge that similarity of structure only after the fact.
See the menu page Analytical Methods for a rundown on where to go for information on Elliott Wave analysis.
By Tim Bovee, Portland, Oregon, August 14, 2025
Disclaimer
Tim Bovee, Private Trader tracks the analysis and trades of a private trader for his own accounts. Nothing in this blog constitutes a recommendation to buy or sell stocks, options or any other financial instrument. The only purpose of this blog is to provide education and entertainment.
No trader is ever 100 percent successful in his or her trades. Trading in the stock and option markets is risky and uncertain. Each trader must make trading decisions for his or her own account, and take responsibility for the consequences.
All content on Tim Bovee, Private Trader by Timothy K. Bovee is licensed under a Creative Commons Attribution-ShareAlike 4.0 International License.
Based on a work at www.timbovee.com.


You must be logged in to post a comment.