3:30 p.m. New York time
Half an hour before the closing bell. The S&P 500 futures continued to decline rapidly and by an hour before the session ends had reached the 6360s
Elliott Wave Theory: That puts the price below the likely range of wave A’s end: 6380 to 6370.
The 2nd subwave, rising wave B, will begin soon. Wave A had five subwaves, which means that the correction is taking the Zigzag pattern. B waves of that pattern tend to retrace 50% to 75% of wave A.
12:50 p.m. New York time
A high-degree correction begins. The S&P 500 futures peaked overnight and the ensing decline picked up speed as the session began. The low point so far is 6402.25.
From this point in the discussion I’ll use the numbering system that appears on the chart: The wave number followed by a degree placement in relation to Intermediate degree, as a subscript in curly brackets. For example, {-15} means 15 degrees below Intermediate degree
Elliott Wave Theory: The price has fallen sufficiently — a 61.8% retracement of wave 5{-18} — to count as validating that the peak price was the end of wave 5{-19}, which we have been tracking. Above that wave are three 5th waves, each one degree higher than the last. They are waves 5{-16}, 5{-17} and 5{-16}.
The next wave one degree larger was wave 3{-15}, which began on July 16 from 6288.25. That wave also met it end today, ushering in wave 4{-15}, a downward correction. That correction is in wave A{-16}.
How low can it go? For wave A{-16}, the downside target is somewhere between 6380 and 6370, based on Fibonacci retracement of the preceding 3rd wave, wave 3{-15}.
There are usually three subwaves in a correction. If that’s the case with wave 4{-15}, then falling wave A{-16} will be followed by rising wave B{-16} and then completed by falling wave C{-16}. For the correction as a whole, the target range of wave 4{-15} is from 6345 to 6315.
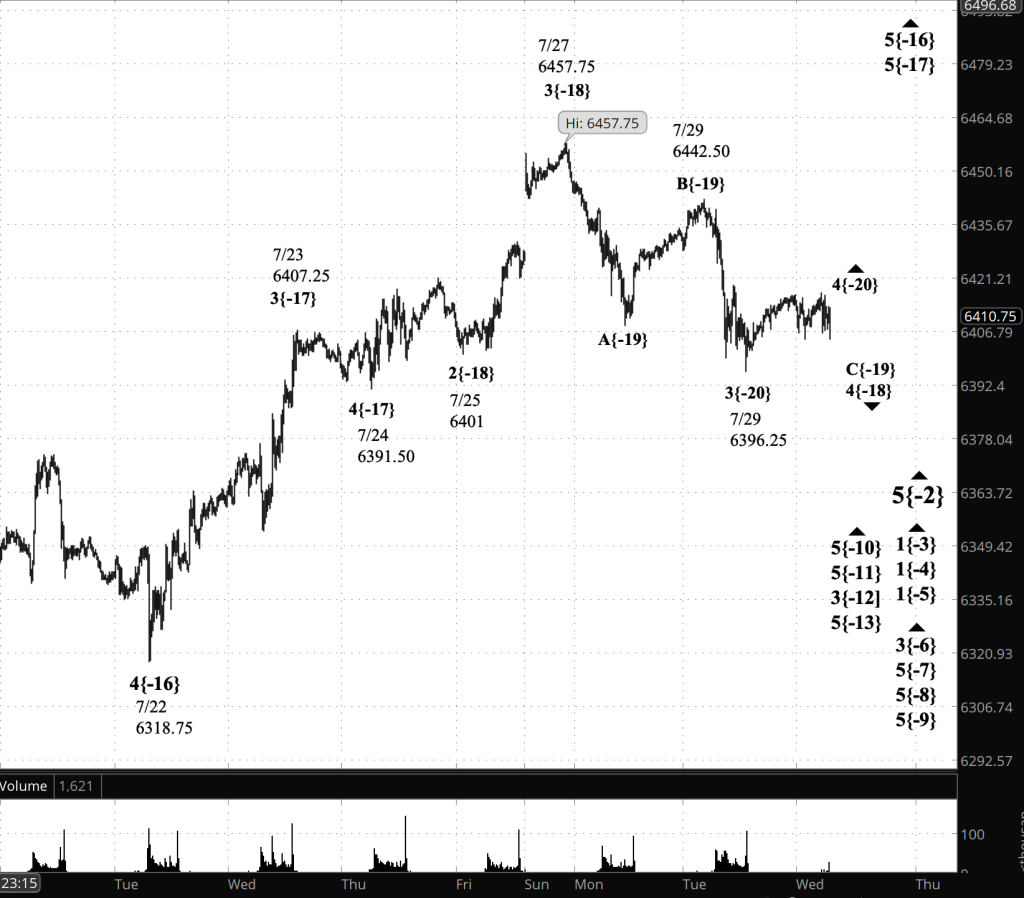
The chart has been updated for the 3:30 p.m. New York time analysis.:

[S&P 500 E-mini futures at 3:30 p.m., 20-minute bars, with volume]
9:35 a.m. New York time.
What’s happening now. The S&P 500 E-mini futures reached an overnight peak of 6468.50 and then pulled back slightly. After the rapid movements with the session, it looks like a return to normalcy.
What does it mean? The sharp rise that began in yesterday’s session, from 6366.75, is anything but normal. Elliott Wave Theory sees it was wave 5, but to make it consistent with other waves of the same degree, I’ve had to mark as the 3rd and 4th subwaves minuscule declines. The decline that began overnight and is still underway is the first break in the rise of significant size, and even it is on the small side relative to the uptrending subwaves.
So am I certain about the structure of the rise? Not in the least. Am I certain that wave 5 is in its 5th subwave, as marked on the chart? Not in the least. Could the rise be an incredibly large 1st wave? I can’t rule it out entirely.
I’m often pounding on the drum of ambiguity, and I’m doing it again today: Ambiguity abounds, and the future, even within the structure of Elliott Wave Theory, is uncertain.

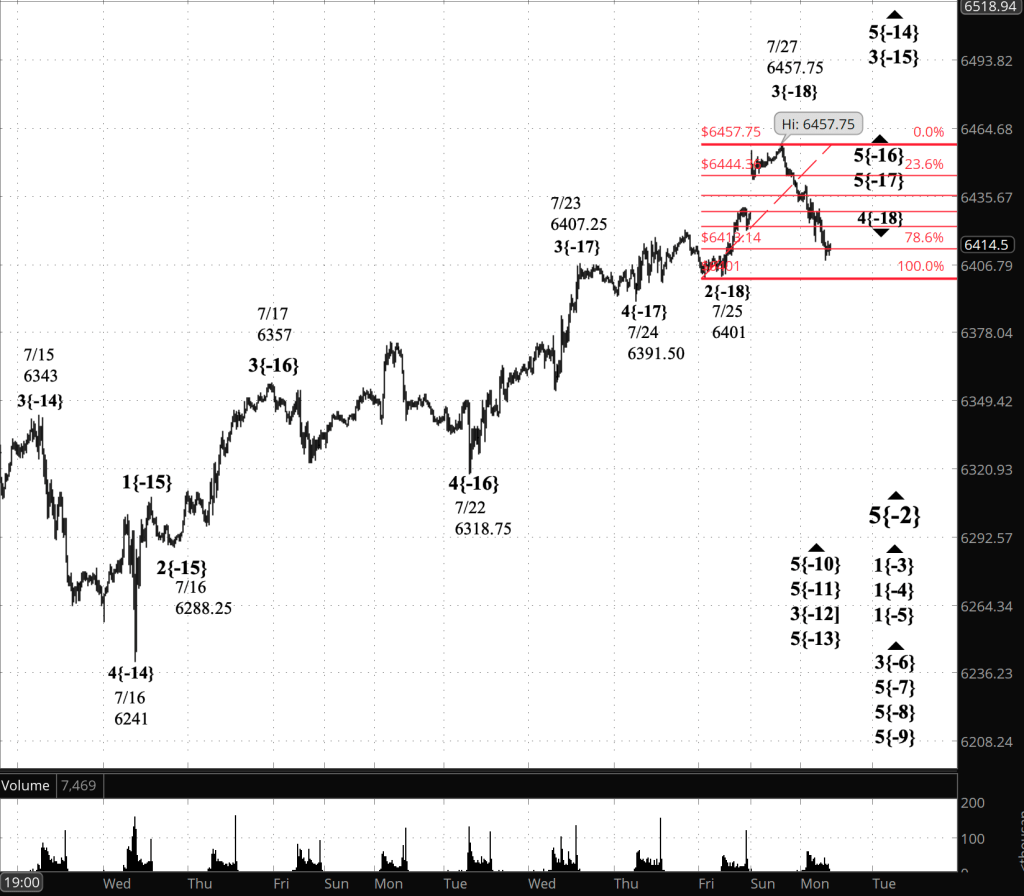
[S&P 500 E-mini futures at 9:35 a.m., 15-minute bars, with volume]
Waves Now Underway
[Updated to match the revised, afternoon analysis.]
These are the waves currently in progress under my principal analysis. Each line on the list shows the wave number, with the subscript in curly brackets, the traditional degree name, the starting date, the starting price of the S&P 500 E-mini futures, and the direction of the wave.
- S&P 500 Index:
- 5{+3} Supercycle, 7/8/1932, 4.40 (up)
- 5{+2} Cycle, 12/9/1974, 60.96 (up)
- 5{+1} Primary, 3/6/2009, 666.79 (up)
- 5{0} Intermediate, 2/11/2016, 1810.10 (up)
- 3{-1} Minor, 3/23/2020, 2191.36 (up)
- 5{-2} Minute, 4/7/2025, 4832 (up)
- S&P 500 Futures
- 1{-3} Minuette, 4/7/2025, 4832 (up)
- 1{-4} Subminuette, 4/7/2025, 4832 (up)
- 1{-5} Micro, 4/7/2025, 4832 (up)
- 3{-6} Submicro, 4/24/2025, 5260 (up)
- 5{-7} Minuscule, 4/25/2025, 5550 (up)
- 5{-8} (unnamed), 5/7/2025, 5596 (up)
- 5{-9} (unnamed), 5/23/2025, 5756.50 (up)
- 5{-10} (unnamed), 6/22/2025, 5959 (up)
- 5{-11} (unnamed), 6/27/2025, 6183.25 (up)
- 3{-12} (unnamed), 6/30/2025, 6224 (up)
- 5{-13} (unnamed), 7/14/2025, 6529.75 (up)
- 5{-14} (unnamed), 7/16/2025, 6241 (up)
- 4{-15} (unnamed), 7/31/2025, 6468.50 (down)
- A{-16} (unnamed}, 7/31/2025, 6488.50 (down
Reading the chart. Price movements — waves – – in Elliott Wave Theory analysis are labeled with numbers within trending waves and letters with corrective waves. The subscripts — numbers in curly brackets — designate the wave’s degree, which, in Elliott Wave analysis, means the relative position of a wave within the larger and smaller structures that make up the chart. R.N. Elliott, who in the 1930s developed the form of analysis that bears his name, viewed the chart as a complex structure of smaller waves nested within larger waves, which in turn are nested within still larger waves. In mathematics it’s called a fractal structure, where at every scale the pattern is similar to the others.
Learning and other resources. Elliott Wave analysis provides context, not prophecy. As the 20th century semanticist Alfred Korzybski put it in his book Science and Sanity (1933), “The map is not the territory … The only usefulness of a map depends on similarity of structure between the empirical world and the map.” And I would add, in the ever-changing markets, we can judge that similarity of structure only after the fact.
See the menu page Analytical Methods for a rundown on where to go for information on Elliott Wave analysis.
By Tim Bovee, Portland, Oregon, July 31, 2025
Disclaimer
Tim Bovee, Private Trader tracks the analysis and trades of a private trader for his own accounts. Nothing in this blog constitutes a recommendation to buy or sell stocks, options or any other financial instrument. The only purpose of this blog is to provide education and entertainment.
No trader is ever 100 percent successful in his or her trades. Trading in the stock and option markets is risky and uncertain. Each trader must make trading decisions for his or her own account, and take responsibility for the consequences.
All content on Tim Bovee, Private Trader by Timothy K. Bovee is licensed under a Creative Commons Attribution-ShareAlike 4.0 International License.
Based on a work at www.timbovee.com.


You must be logged in to post a comment.