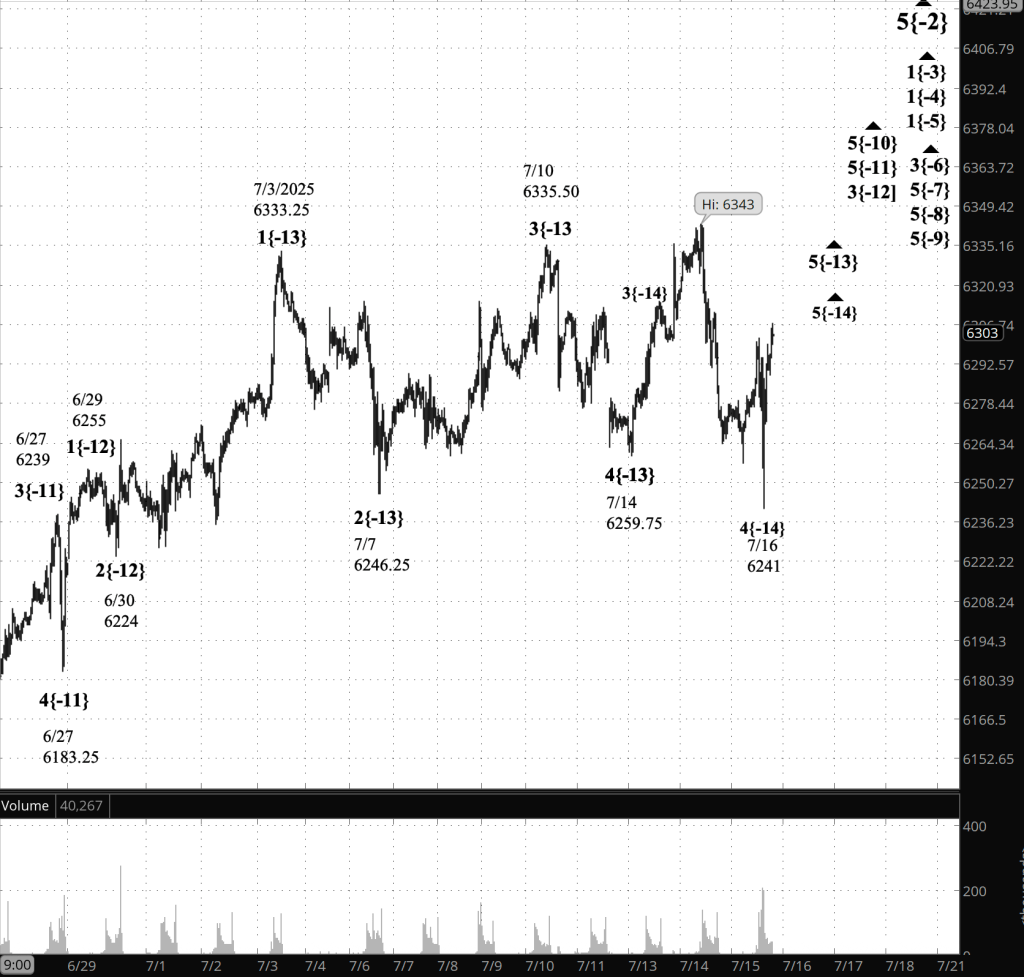
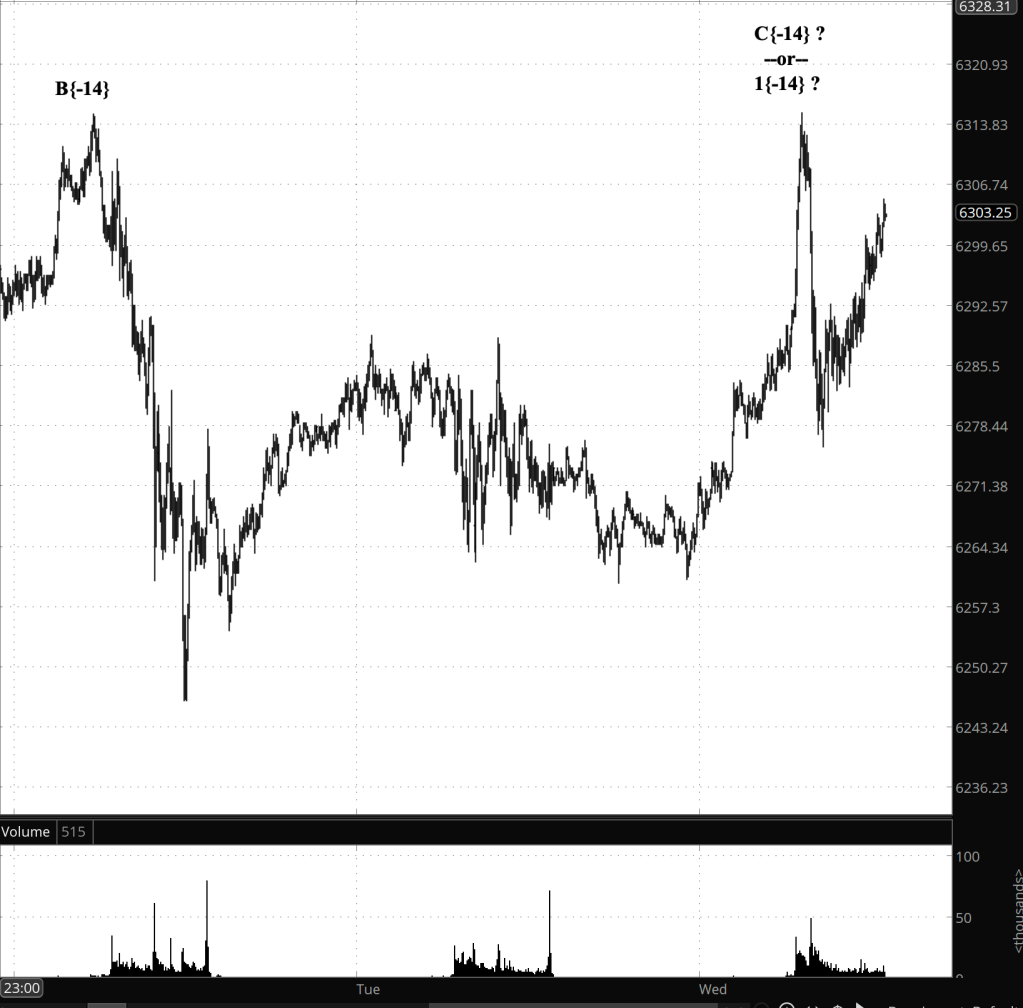
3:30 p.m. New York time
Half an hour before the closing bell. The S&P 500 futures continued to climb during the session, so far reaching into the 6340s.
Elliott Wave Theory: Wave 5 has been underway since July 16 and it has reached beyond the 1.272 Fibonacci retracement level of wave 3. The next likely stopping point is the 1.618 retracement level, at
From the form the rise has taken, it seems likely to me that more upside lies ahead. Using the nomenclature on the chart, where the wave number is followed by a subscript in brackets noting the wave’s distance in degrees from Intermediate degree, I see wave 5{-14}, which began on July 16, as being in its 3rd subwave, wave 3{-15}, which in turn is in its 3rd subwave, wave 3{-16}. We’re down to near microscopic waves at this point.
Anyhow, bottom line, there’s time to go until we correct.
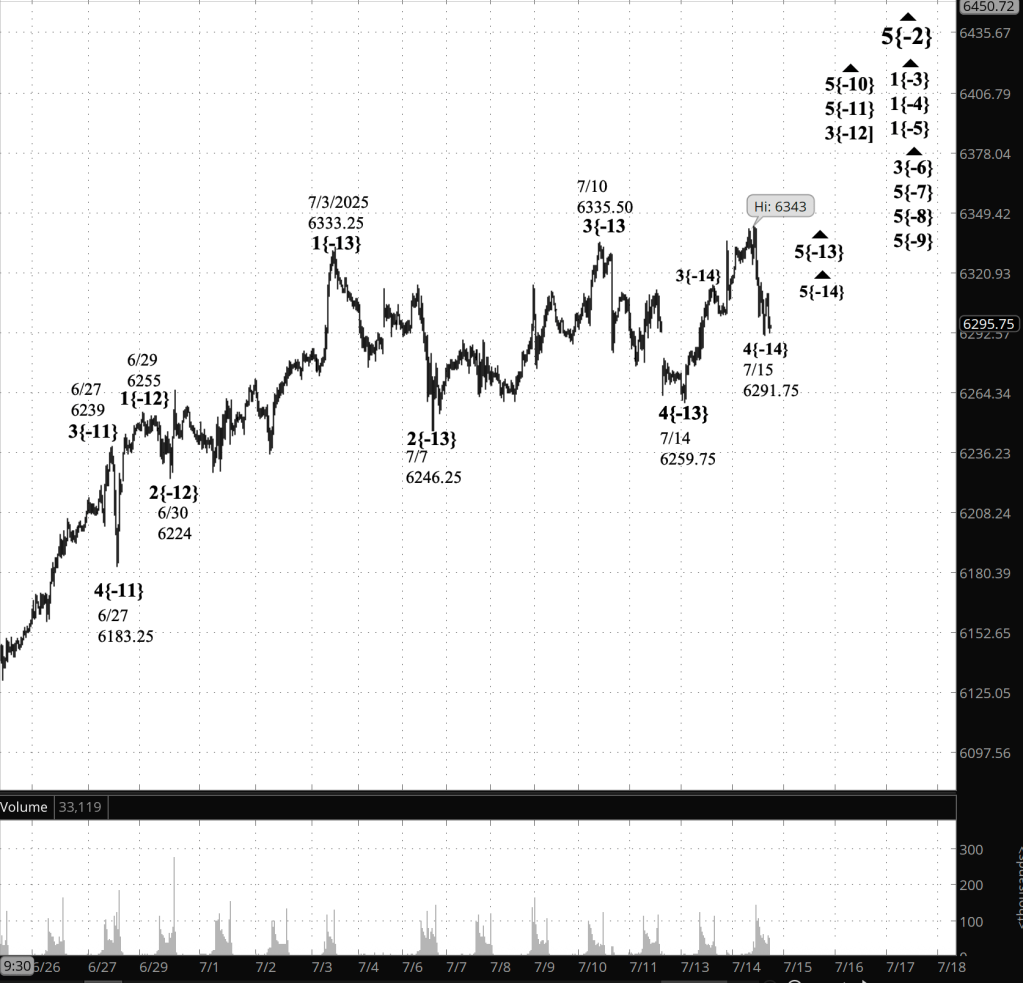
9:35 a.m. New York time.
What’s happening now. The S&P 500 E-mini futures rose overnight from the 6280s to the 6320s.
What does it mean? In the terminology of Elliott Wave Theory, uptrending wave 5 continues. It began on July 16 and is a subwave of a larger wave 5, which began on July 14.
Applying the Fibonacci retracements of the prior wave 3, here are the likely endpoints for wave 5.
- Same as wave 3: 6316.75
- 1.272 times the length of wave 3: Just below 6338
- 1.618 times the length of wave 3: Just below 6366
As is often the case in Elliott Wave Theory analysis, these are estimates. Fifth waves, famously, are quite capable of surprises.
The end of the smaller wave 5 will also be the end of the larger wave 5 and of its parent wave 3, which will be followed by a 4th-wave downward correction larger by two degrees than the most recent 4th wave we’ve experienced, the one ending on July 16.

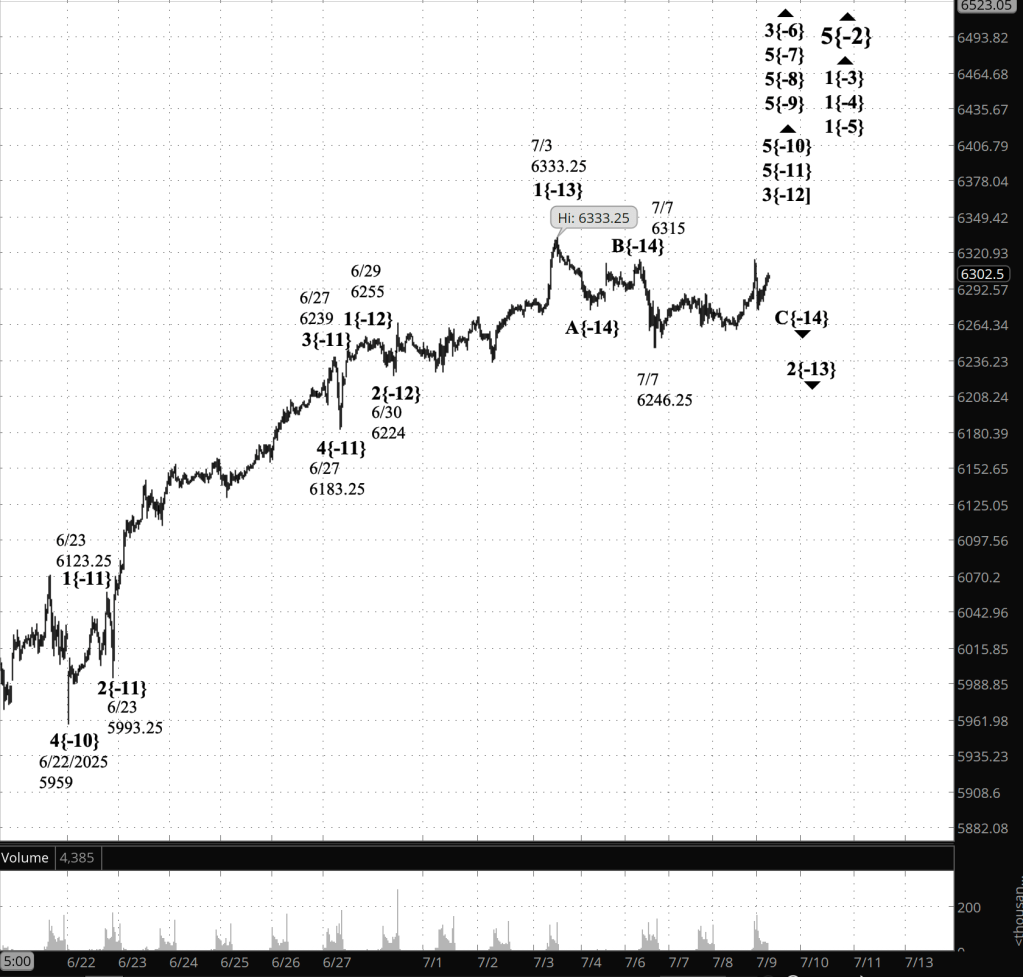
[S&P 500 E-mini futures at 9:35 a.m., 35-minute bars, with volume]
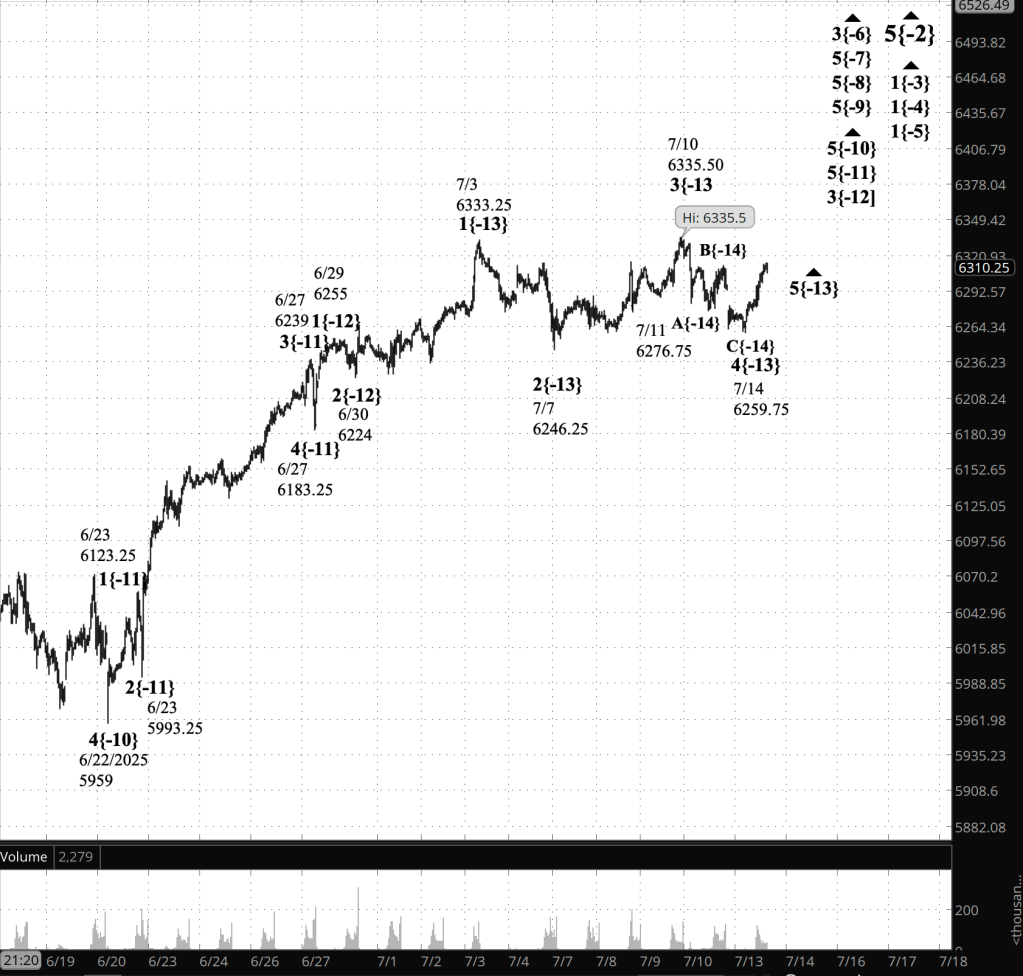
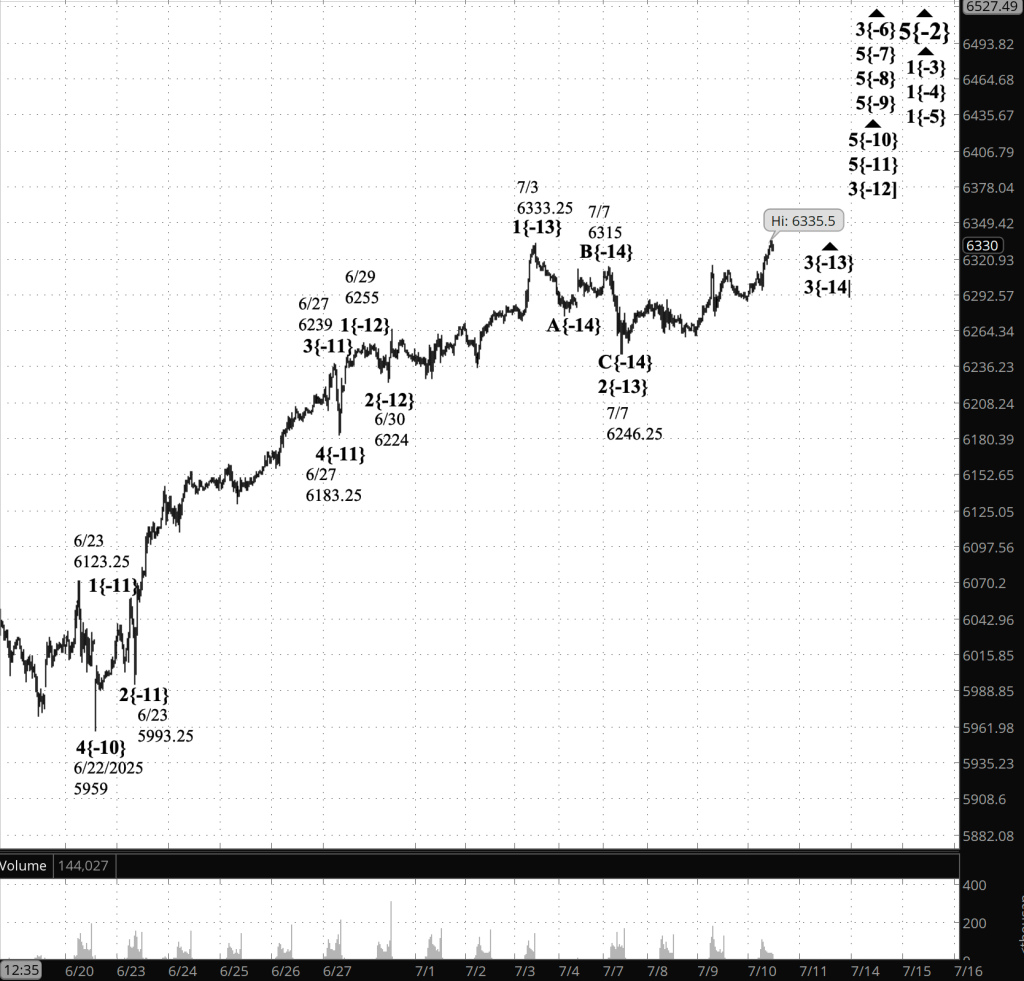
Waves Now Underway
These are the waves currently in progress under my principal analysis. Each line on the list shows the wave number, with the subscript in curly brackets, the traditional degree name, the starting date, the starting price of the S&P 500 E-mini futures, and the direction of the wave.
- S&P 500 Index:
- 5{+3} Supercycle, 7/8/1932, 4.40 (up)
- 5{+2} Cycle, 12/9/1974, 60.96 (up)
- 5{+1} Primary, 3/6/2009, 666.79 (up)
- 5{0} Intermediate, 2/11/2016, 1810.10 (up)
- 3{-1} Minor, 3/23/2020, 2191.36 (up)
- 5{-2} Minute, 4/7/2025, 4832 (up)
- S&P 500 Futures
- 1{-3} Minuette, 4/7/2025, 4832 (up)
- 1{-4} Subminuette, 4/7/2025, 4832 (up)
- 1{-5} Micro, 4/7/2025, 4832 (up)
- 3{-6} Submicro, 4/24/2025, 5260 (up)
- 5{-7} Minuscule, 4/25/2025, 5550 (up)
- 5{-8} (unnamed), 5/7/2025, 5596 (up)
- 5{-9} (unnamed), 5/23/2025, 5756.50 (up)
- 5{-10} (unnamed), 6/22/2025, 5959 (up)
- 5{-11} (unnamed), 6/27/2025, 6183.25 (up)
- 3{-12} (unnamed), 6/30/2025, 6224 (up)
- 5{-13} (unnamed), 7/14/2025, 6529.75 (up)
- 5{-14} (unnamed), 7/16/2025, 6241 (up)
Reading the chart. Price movements — waves – – in Elliott Wave Theory analysis are labeled with numbers within trending waves and letters with corrective waves. The subscripts — numbers in curly brackets — designate the wave’s degree, which, in Elliott Wave analysis, means the relative position of a wave within the larger and smaller structures that make up the chart. R.N. Elliott, who in the 1930s developed the form of analysis that bears his name, viewed the chart as a complex structure of smaller waves nested within larger waves, which in turn are nested within still larger waves. In mathematics it’s called a fractal structure, where at every scale the pattern is similar to the others.
Learning and other resources. Elliott Wave analysis provides context, not prophecy. As the 20th century semanticist Alfred Korzybski put it in his book Science and Sanity (1933), “The map is not the territory … The only usefulness of a map depends on similarity of structure between the empirical world and the map.” And I would add, in the ever-changing markets, we can judge that similarity of structure only after the fact.
See the menu page Analytical Methods for a rundown on where to go for information on Elliott Wave analysis.
By Tim Bovee, Portland, Oregon, July 17, 2025
Disclaimer
Tim Bovee, Private Trader tracks the analysis and trades of a private trader for his own accounts. Nothing in this blog constitutes a recommendation to buy or sell stocks, options or any other financial instrument. The only purpose of this blog is to provide education and entertainment.
No trader is ever 100 percent successful in his or her trades. Trading in the stock and option markets is risky and uncertain. Each trader must make trading decisions for his or her own account, and take responsibility for the consequences.
All content on Tim Bovee, Private Trader by Timothy K. Bovee is licensed under a Creative Commons Attribution-ShareAlike 4.0 International License.
Based on a work at www.timbovee.com.


You must be logged in to post a comment.