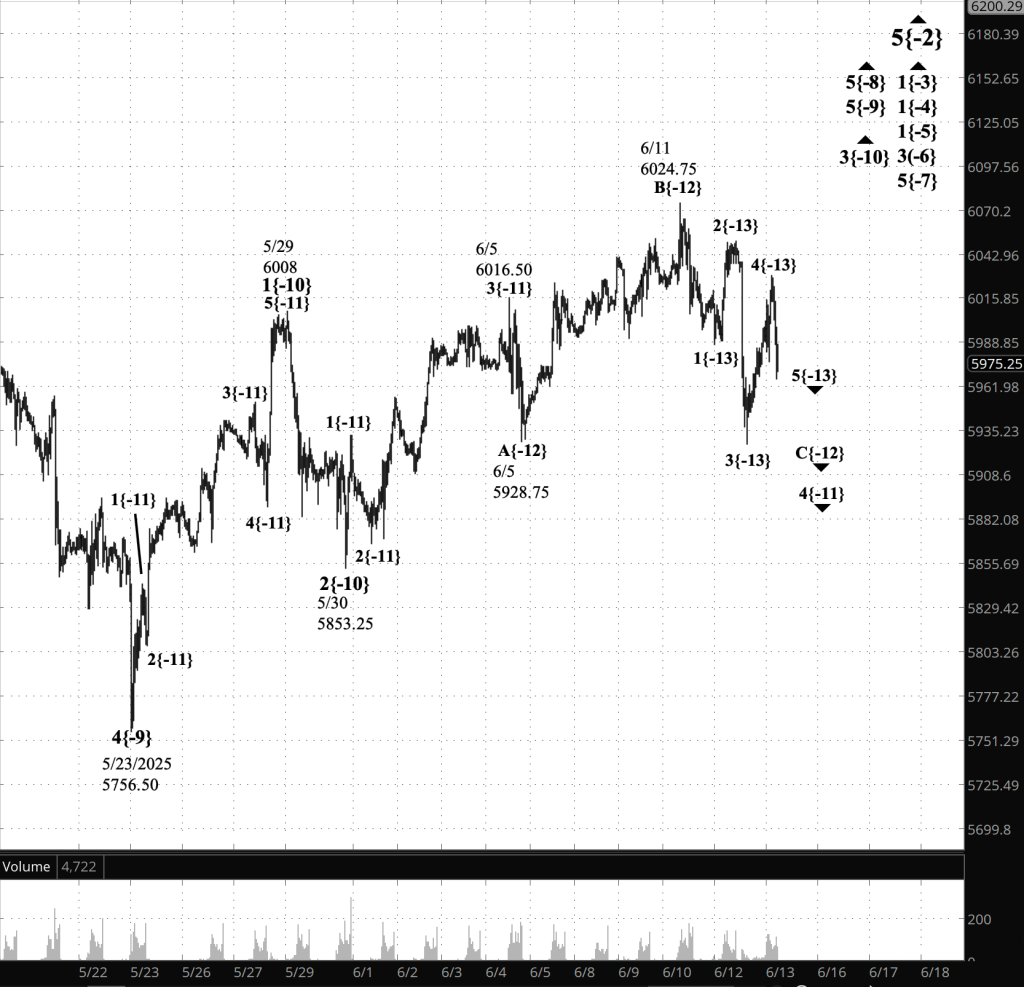
3:30 p.m. New York time
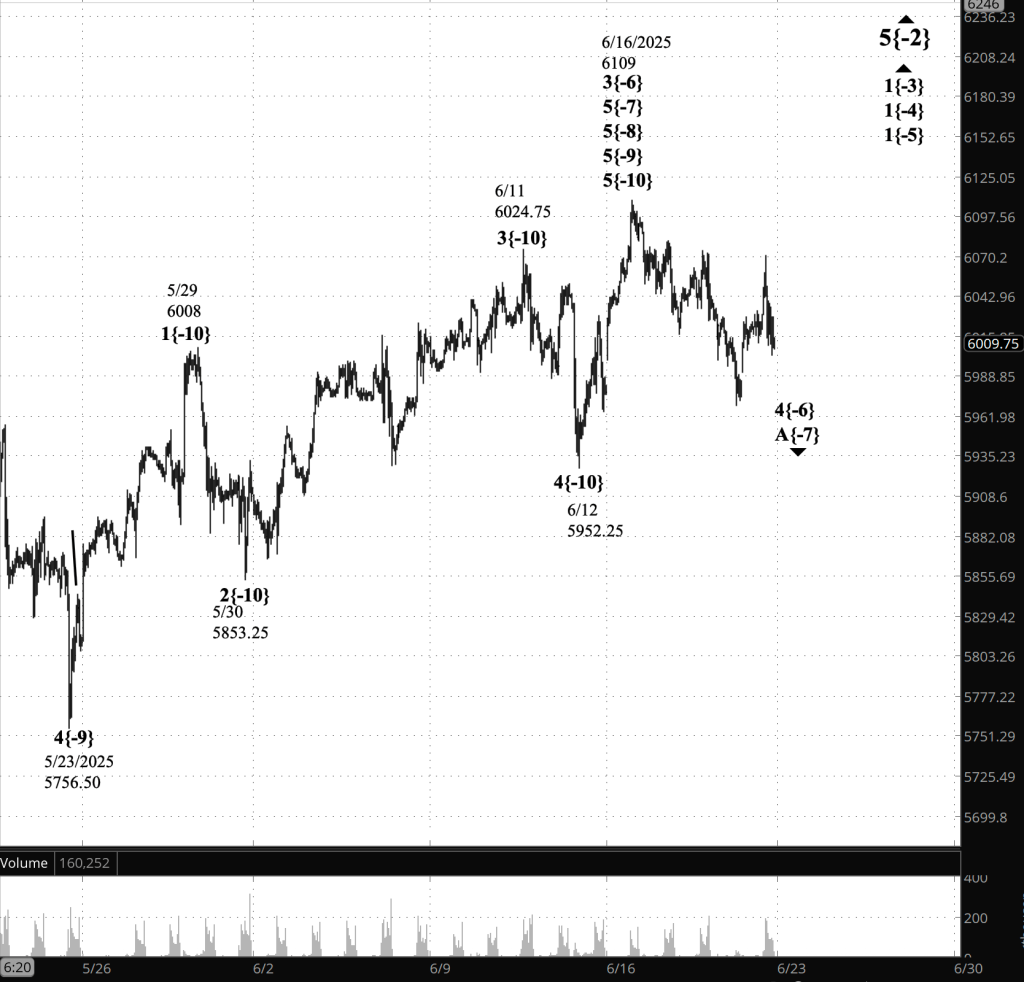
Half an hour before the closing bell. The S&P 500 futures continued rising during the session, reaching to within 25 cents of the 6070 mark.
Elliott Wave Theory: Declining wave A, the first subwave within the declining 4th wave that began on June 16, continues.
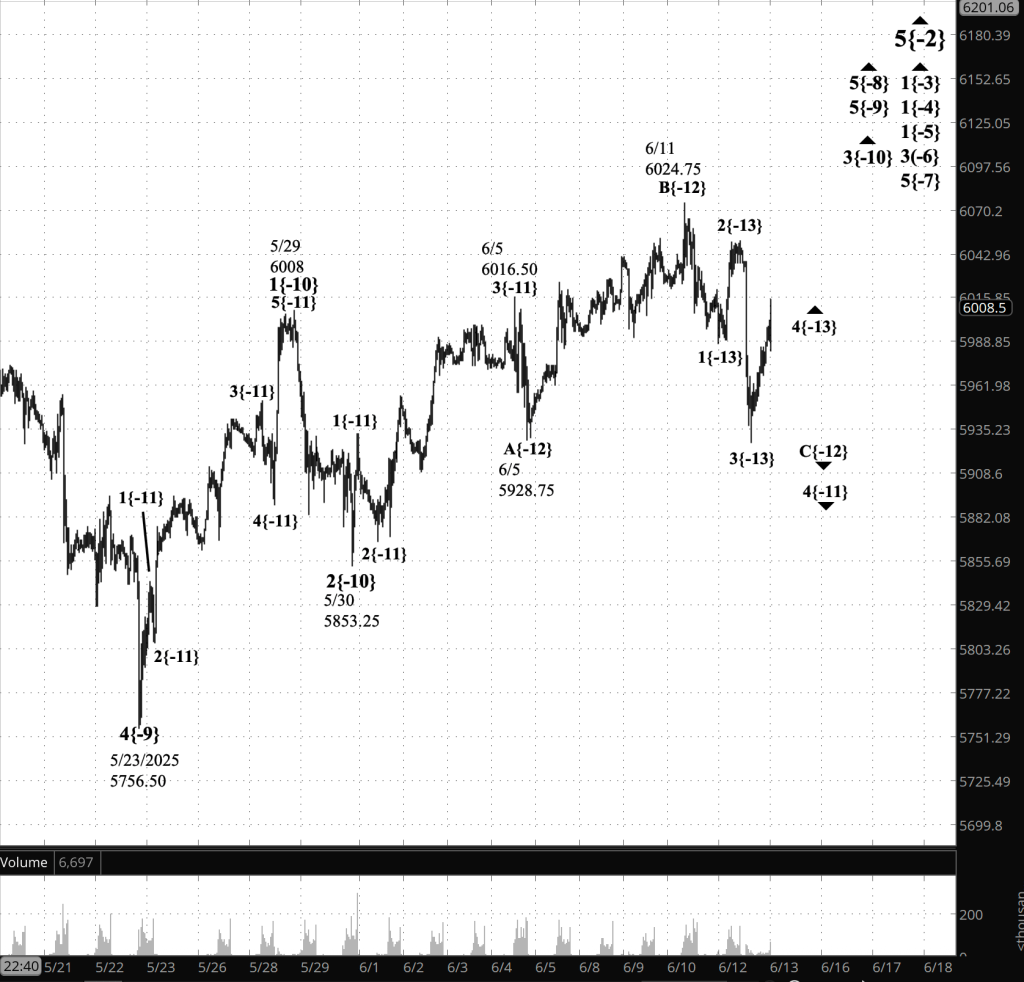
9:35 a.m. New York time.
What’s happening now. The United States launched an air attack on nuclear facilities in Iran over the weekend. The S&P 500 E-mini futures ended last week at 6025, before the attack. It resumed trading from 5959 and immediately began to rise, so far reaching into the 6030s. In other words, a minute of drama followed by trading as usual.
What does it mean? Elliott Wave Theory analysis has the S&P 500 futures reaching a major turning point on June 16, triggering the end of four degrees of 5th waves and ushering in a batch of initial subwaves within a 4th-wave downward correction, wave 4{-6} on the chart, within the early stages of a downtrend. The preceding 3rd wave began on April 21, two months ago, and since 4th waves tend to be shorter than 3rd waves, It will be a long decline that we’ve grown used to but not hugely so.
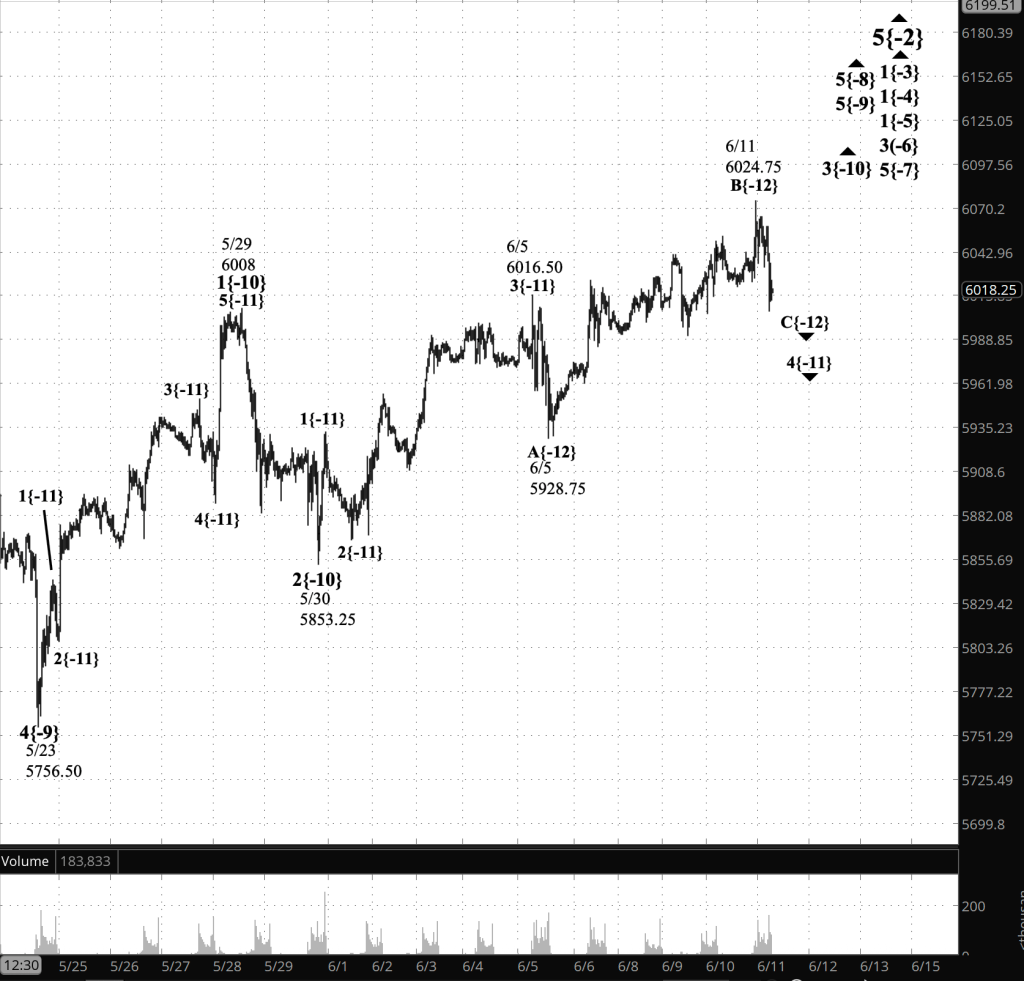
One quirk of Elliott Wave Theory is the difficulty of precisely locating degrees. There’s insufficient data. So the wave 4{-6} label and wave A{-7} labels are precise, but the degrees of the waves within wave A{-7} so far lack clarity

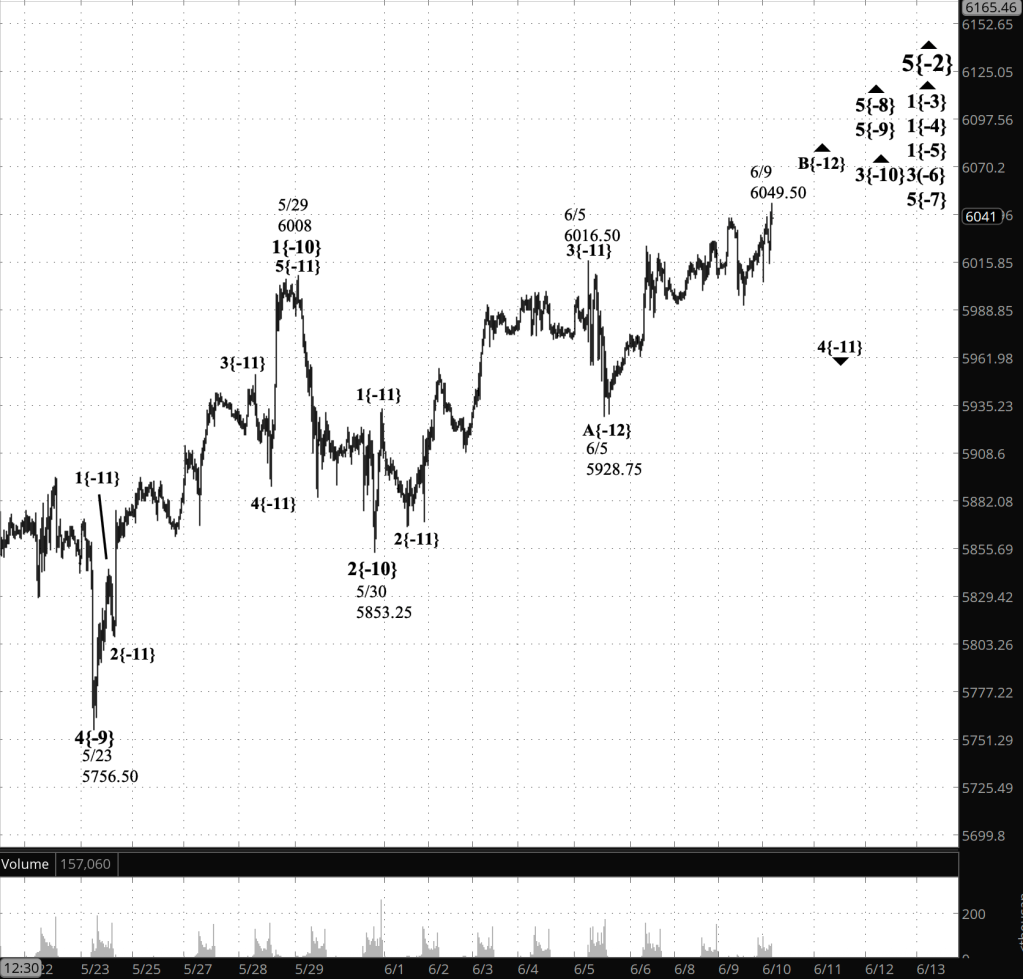
[S&P 500 E-mini futures at 3:30 p.m., 55-minute bars, with volume]
Waves Now Underway
These are the waves currently in progress under my principal analysis. Each line on the list shows the wave number, with the subscript in curly brackets, the traditional degree name, the starting date, the starting price of the S&P 500 E-mini futures, and the direction of the wave.
- S&P 500 Index:
- 5{+3} Supercycle, 7/8/1932, 4.40 (up)
- 5{+2} Cycle, 12/9/1974, 60.96 (up)
- 5{+1} Primary, 3/6/2009, 666.79 (up)
- 5{0} Intermediate, 2/11/2016, 1810.10 (up)
- 3{-1} Minor, 3/23/2020, 2191.36 (up)
- 5{-2} Minute, 4/7/2025, 4832 (up)
- S&P 500 Futures
- 1{-3} Minuette, 4/7/2025, 4832 (up)
- 1{-4} Subminuette, 4/7/2025, 4832 (up)
- 1{-5} Micro, 4/7/2025, 4832 (up)
- 4{-6} Submicro, 6/16/2025, 6109 (down)
- A{-7} Minuscule, 6/16/2025, 6109 (down)
Reading the chart. Price movements — waves – – in Elliott Wave Theory analysis are labeled with numbers within trending waves and letters with corrective waves. The subscripts — numbers in curly brackets — designate the wave’s degree, which, in Elliott Wave analysis, means the relative position of a wave within the larger and smaller structures that make up the chart. R.N. Elliott, who in the 1930s developed the form of analysis that bears his name, viewed the chart as a complex structure of smaller waves nested within larger waves, which in turn are nested within still larger waves. In mathematics it’s called a fractal structure, where at every scale the pattern is similar to the others.
Learning and other resources. Elliott Wave analysis provides context, not prophecy. As the 20th century semanticist Alfred Korzybski put it in his book Science and Sanity (1933), “The map is not the territory … The only usefulness of a map depends on similarity of structure between the empirical world and the map.” And I would add, in the ever-changing markets, we can judge that similarity of structure only after the fact.
See the menu page Analytical Methods for a rundown on where to go for information on Elliott Wave analysis.
By Tim Bovee, Portland, Oregon, June 23, 2025
Disclaimer
Tim Bovee, Private Trader tracks the analysis and trades of a private trader for his own accounts. Nothing in this blog constitutes a recommendation to buy or sell stocks, options or any other financial instrument. The only purpose of this blog is to provide education and entertainment.
No trader is ever 100 percent successful in his or her trades. Trading in the stock and option markets is risky and uncertain. Each trader must make trading decisions for his or her own account, and take responsibility for the consequences.
All content on Tim Bovee, Private Trader by Timothy K. Bovee is licensed under a Creative Commons Attribution-ShareAlike 4.0 International License.
Based on a work at www.timbovee.com.


You must be logged in to post a comment.