1:30 p.m. New York time
Early closure for Memorial Day weekend. U.S. markets will close early today, at 2 p.m. New York time and will be closed all day on Monday, May 26,.
Half an hour before the closing bell. The S&P 500 futures rose throughout the session, from the overnight low of 5756.50 to the 5830s as the closing bell approached. Elliott Wave Theory: Wave 4 continues and may have ended Wave A at the overnight low. If that’s the case, then rising wave B is underway.
The rise allowed the chart to avoid, for the moment, breaking a rule of Elliott Wave Theory. See the disussion below
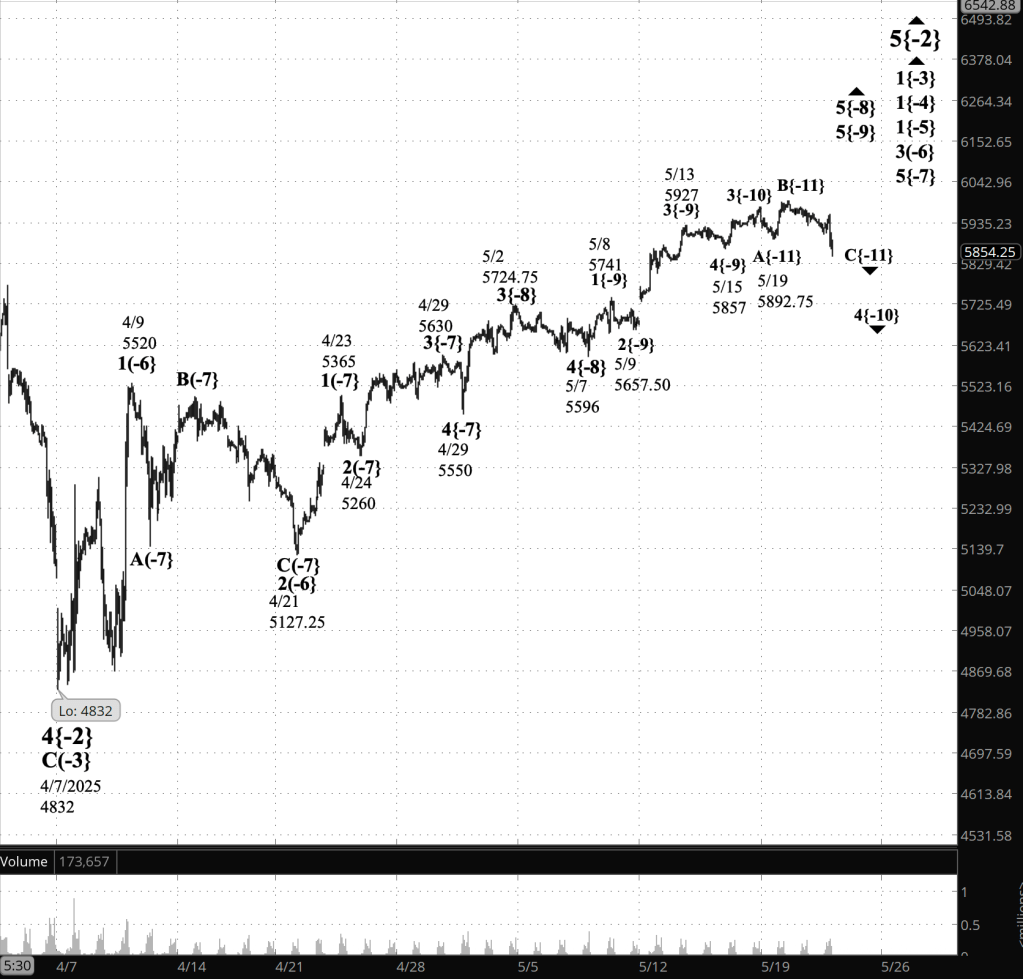
9:35 a.m. New York time
What’s happening now. The S&P 500 E-mini futures fell overnight, from 5672 so far down to 5756.50.
What does it mean? Last night’s Elliott Wave Theory analysis labels the decline as wave A within a declining 4th wave that began on May 19.
However, the overnight decline has brought the 4th wave perilously close to violating a rule of Elliott wave theory: A 4th wave can’t cross the end of the preceding 1st wave. Wave 1 ended on May 8 at 5741. Wave 4, as noted above, has reached a low ovrnight of 5756.50.
So the rule remains intact, but barely. Wave 4 is 15.5 points above the end of wave 1.
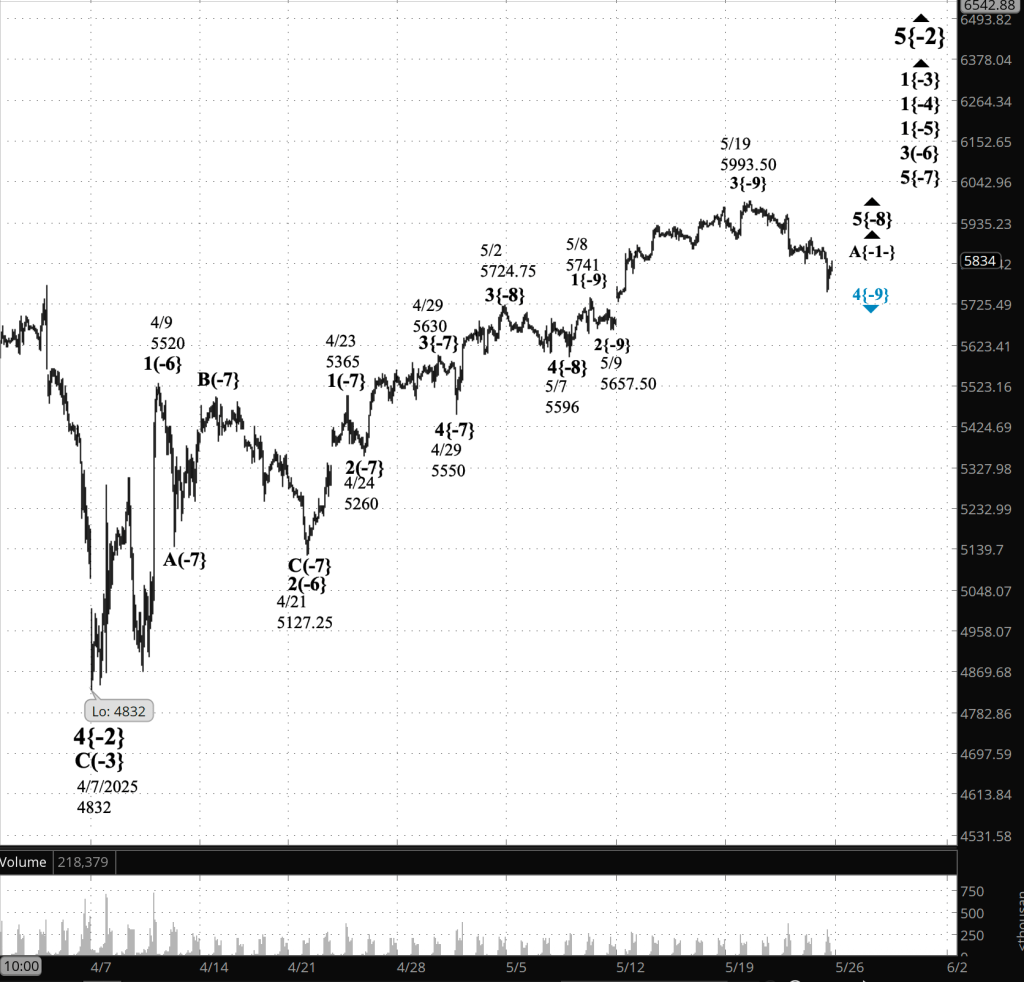
[S&P 500 E-mini futures at 1:30 p.m., 75-minute bars, with volume]
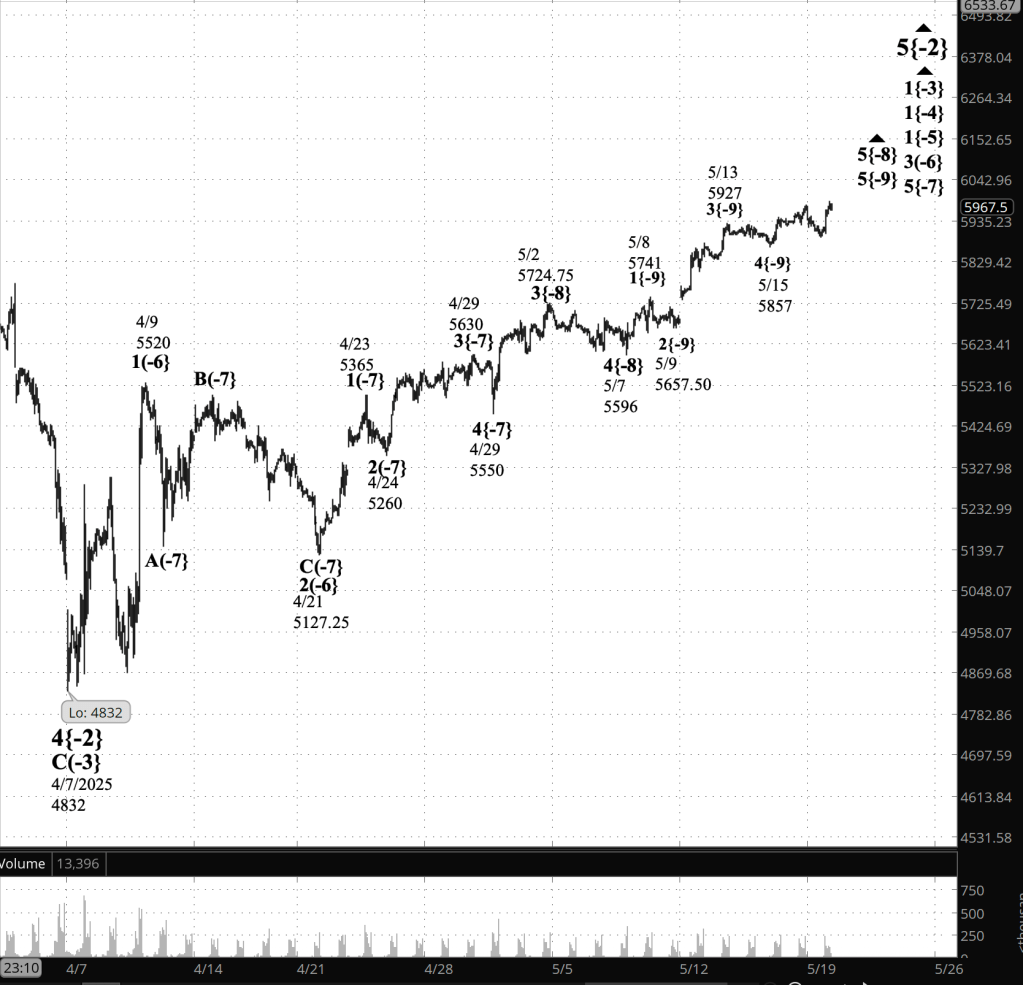
Elliott Wave Theory wave labels. Each wave listed on the charts has two components: A wave number, and a subscript in curly brackets that place the wave’s position in the fractal strucutre in relationship to Intermediate degree. The present Intermediate degree, wave 5{0}, began its rise on February 11, 2016 from 1810.10 and is still underway.
The waves referred to on the chart are as follows.
Principal analysis: Upward correction wave 5{-2} is underway and within it is working through a nested series of initial subwaves, wave 1{-3} down to wave 1{-5}. One degree lower, rising wave 3{-6} is underway and is in its final subwave, wave 5{-7},
Within wave 5{-7}, uptrending wave 5{-8} is in its next-to-the-last stage, a downward correction, wave 4{-9}.
Within wave 4{-9}, its initial subwave, wave A{-10}, may be underway, or perhaps it has ended and wave B{-10} has begun.
Waves Now Underway
These are the waves currently in progress under my principal analysis. Each line on the list shows the wave number, with the subscript in curly brackets, the traditional degree name, the starting date, the starting price of the S&P 500 E-mini futures, and the direction of the wave.
- S&P 500 Index:
- 5{+3} Supercycle, 7/8/1932, 4.40 (up)
- 5{+2} Cycle, 12/9/1974, 60.96 (up)
- 5{+1} Primary, 3/6/2009, 666.79 (up)
- 5{0} Intermediate, 2/11/2016, 1810.10 (up)
- 3{-1} Minor, 3/23/2020, 2191.36 (up)
- 5{-2} Minute, 4/7/2025, 4832 (up)
- S&P 500 Futures
- 1{-3} Minuette, 4/7/2025, 4832 (up)
- 1{-4} Subminuette, 4/7/2025, 4832 (up)
- 1{-5} Micro, 4/7/2025, 4832 (up)
- 3{-6} Submicro, 4/21/2025, 4832 (up)
Reading the chart. Price movements — waves – – in Elliott Wave Theory analysis are labeled with numbers within trending waves and letters with corrective waves. The subscripts — numbers in curly brackets — designate the wave’s degree, which, in Elliott Wave analysis, means the relative position of a wave within the larger and smaller structures that make up the chart. R.N. Elliott, who in the 1930s developed the form of analysis that bears his name, viewed the chart as a complex structure of smaller waves nested within larger waves, which in turn are nested within still larger waves. In mathematics it’s called a fractal structure, where at every scale the pattern is similar to the others.
Learning and other resources. Elliott Wave analysis provides context, not prophecy. As the 20th century semanticist Alfred Korzybski put it in his book Science and Sanity (1933), “The map is not the territory … The only usefulness of a map depends on similarity of structure between the empirical world and the map.” And I would add, in the ever-changing markets, we can judge that similarity of structure only after the fact.
See the menu page Analytical Methods for a rundown on where to go for information on Elliott Wave analysis.
By Tim Bovee, Portland, Oregon, May 23, 2025
Disclaimer
Tim Bovee, Private Trader tracks the analysis and trades of a private trader for his own accounts. Nothing in this blog constitutes a recommendation to buy or sell stocks, options or any other financial instrument. The only purpose of this blog is to provide education and entertainment.
No trader is ever 100 percent successful in his or her trades. Trading in the stock and option markets is risky and uncertain. Each trader must make trading decisions for his or her own account, and take responsibility for the consequences.
All content on Tim Bovee, Private Trader by Timothy K. Bovee is licensed under a Creative Commons Attribution-ShareAlike 4.0 International License.
Based on a work at www.timbovee.com


You must be logged in to post a comment.