U.S. stock and option markets will be closed on Thursday to honor President Jimmy Carter, who held office from 1977 to 1981 and who died on December 29 at the age of 100. Bond markets will close at 2 p.m., and futures markets will trade as usual. I shall post my analyses at of the S&P 500 E-mini futures at 9:35 a.m. and at 3:30 p.m. New York time.
3:30 p.m. New York time
Half an hour before the closing bell. The S&P 500 futures rose during the session back into the 5970s. The ambiguous Elliott Wave Theory pattern from this morning continues, within the wave B subwave within a declining 4th-wave correction\. The structure of the B wave suggests that either the B wave is taking a less common form, or the wave movement has been ambiguous enough to produce an error in the count.
9:35 a.m. New York time
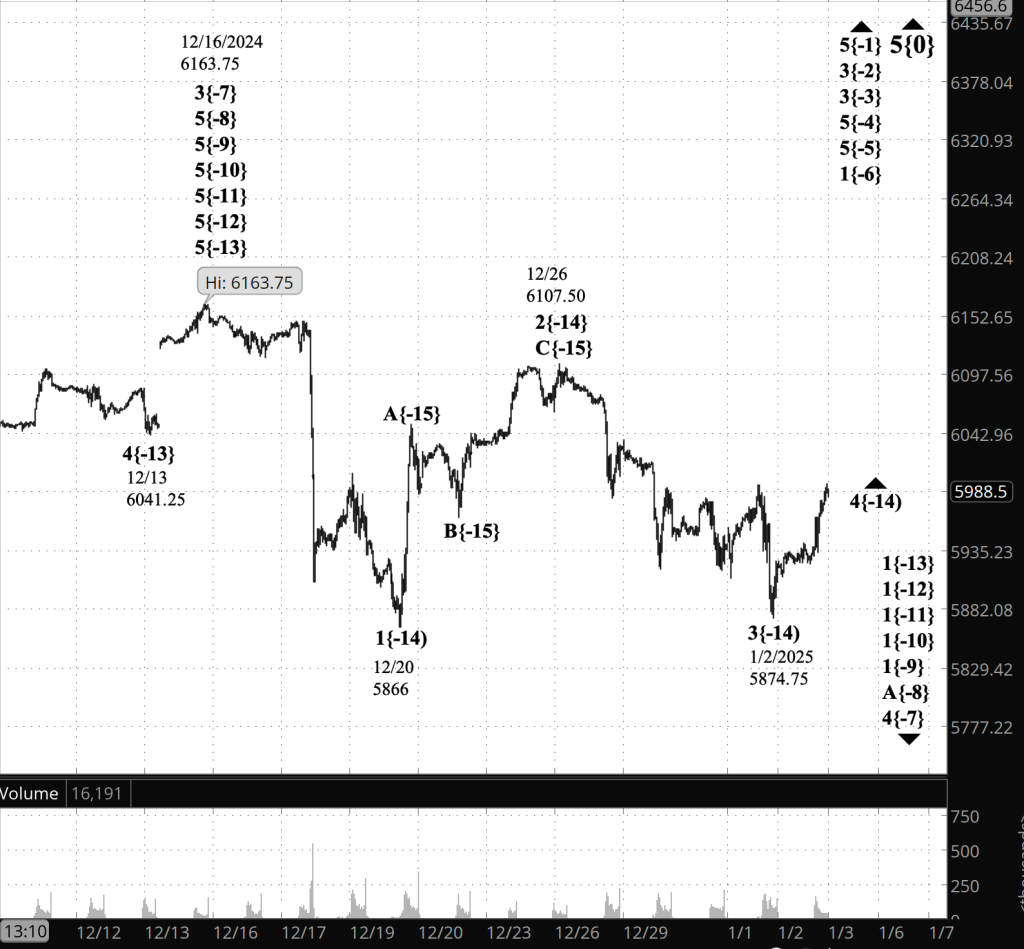
What’s happening now? The S&P 500 E-mini futures drifted slightly higher overnight, to 5975, and then fell sharply into the 5970s. The price rose again after the ADP Employment Report, a sneak preview of the government’s Employment situation report on Friday, found that fewer jobs had been added than expected.
What does it mean? In line with the Elliott Wave Theory pattern that has been developing since January 2, the decline is a continuation of the middle subwave, wave B, within a 4th-wave upward correction. That correction, in turn, is part of a downtrending 1st wave that began on December 16.
But there’s a problem. B waves in such corrections have three subwaves.
What are the alternatives? So what’s going on here? Some possibilities:
Diagonal Wave (Leading or Ending):
- The five subwaves could represent a diagonal structure. If this is an ending diagonal, it could suggest a termination of the correction at this wave degree.
- If it is a leading diagonal, it might imply that the B wave is morphing into something more complex, such as a larger wave C{-15} starting soon.
Part of a Flat Correction:
- If Wave B{-15} is within a flat correction, it might develop into an irregular or expanded flat where wave B exceeds the start of wave A and wave C will move in the opposite direction.
- In this case, the five-wave pattern would still fit within the corrective context but may reflect a “running” or “expanded” flat.
Complex Correction:
- Wave B{-15} may belong to a complex corrective wave structure such as a combination (e.g., W-X-Y) or a triangle, which could sometimes give the illusion of a five-wave pattern.
And there may be some other possibilities.
As is so often the case in Elliott Wave Analysis, time will tell. In the meantime, I’ve retained the labeling but have added a question mark after the wave B{-15} label.
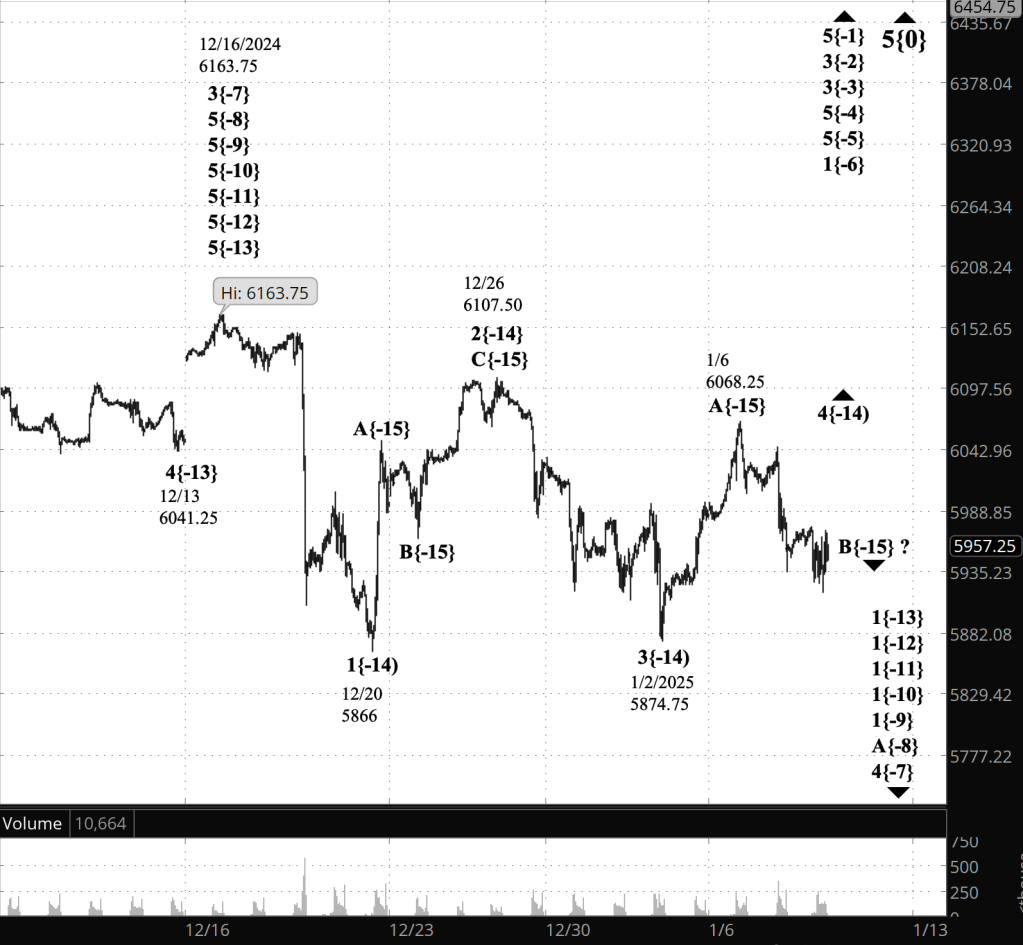
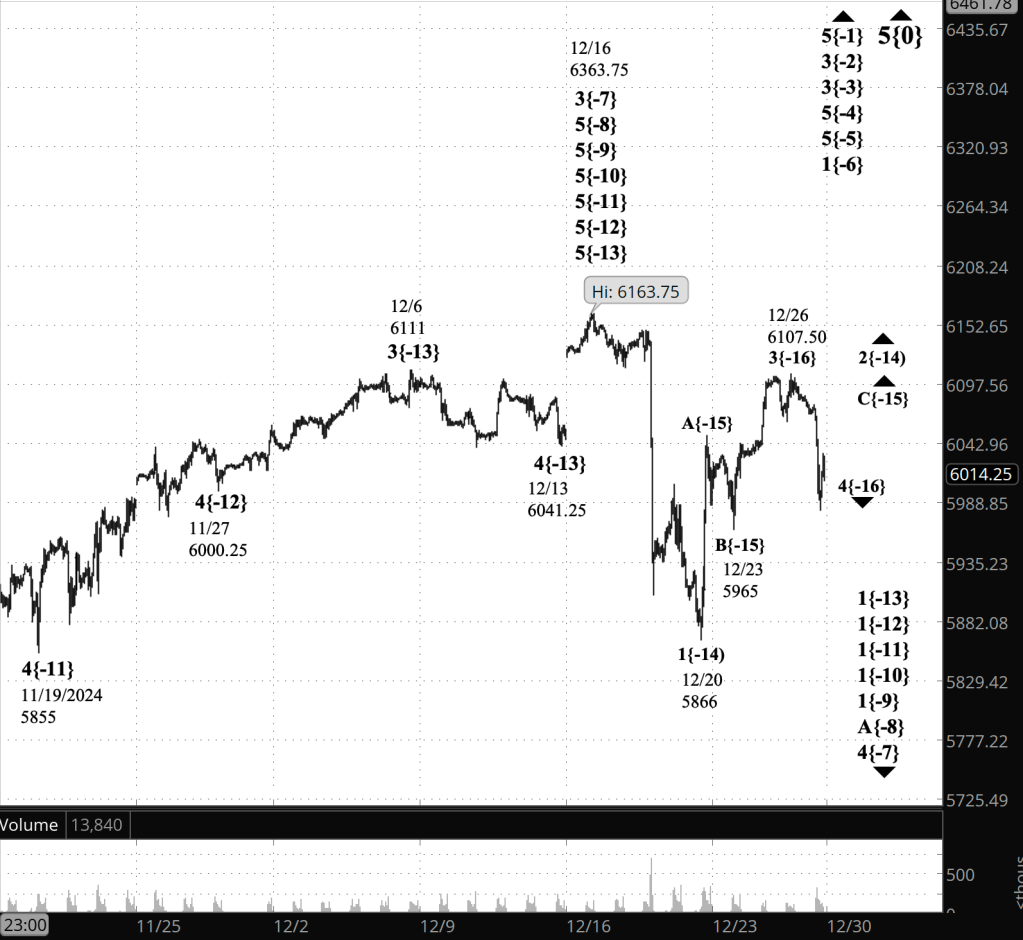
[S&P 500 E-mini futures at 3:30 p.m., 45-minute bars, with volume]
What does Elliott wave theory say? Here are the waves that underly the analyses.
Principal Analysis:
- .Rising wave 5{0} is underway. It is a wave of Intermediate degree that began in December 2018.
- It is in its final subwave, wave 5{-1}.
- Within wave 5{-1}, rising waves 5{-2}, 5{-3} and 5{-4} are underway, as is wave 5{-5}.
- Wave 5{-5} is in its initial subwave, wave 1{-6}, which in turn is in its middle subwave, wave 3{-7}.
- Wave 4{-7} is in its initial; subwave, uptrending wave A{-8}.
- Wave 1{-8} is in its initial subwave, wave 1{-9}, which is in its final subwave, uptrending wave 5{-10}.
- Wave 1{-10} is in its initial subwave, as are waves 1{-11}, 1{-12}, and 1{-13}.
- Wave 4{-14} is presently underway and is rising.
Long-term Waves.
These are the waves currently in progress under my principal analysis. Each line on the list shows the wave number, with the subscript in curly brackets, the traditional degree name, the starting date, the starting price of the S&P 500 E-mini futures, and the direction of the wave.
- S&P 500 Index:
- 5{+3} Supercycle, 7/8/1932, 4.40 (up)
- 5{+2} Cycle, 12/9/1974, 60.96 (up)
- 5{+1} Primary, 3/6/2009, 666.79 (up)
- 5{0} Intermediate, 12/26/2018, 2346.58 (up)
- S&P 500 Futures
- 5{-1} Minor, 10/27/2023, 4127.25 (up)
- 3{-2} Minute, 10/27/23, 4127.75 (up)
- 3{-3} Minuette, 10/27/23, 4127.75 (up)
- 5{-4} Subminuette, 4/18/2024, 4963.50 (up)
- 5{-5} Micro, 8/5/2024, 5120 (up)
- 1{-6} Submicro, 8/5/2024, 5120 (up)
- 4{-7} Minuscule, 12/16/2024, 6163.75 (down)
- A{-8} (unnamed), 12/16/2024, 6163.75 (down)
- 1{-9} (unnamed), 12/16/2024, 6163.75 (down)
- 1{-10} (unnamed), 12/16/2024, 6163.75 (down)
- 1{-11} (unnamed), 12/16/2024, 6163.75 (down)
- 1{-12} (unnamed), 12/16/2024, 6163.75 (down)
- 1{-13} (unnamed), 12/16/2024, 6163.75 (down)
- 4[-14} (unnamed), 1/2/2025, 5874.75 (up)
Reading the chart. Price movements — waves – – in Elliott wave analysis are labeled with numbers within trending waves and letters with corrective waves. The subscripts — numbers in curly brackets — designate the wave’s degree, which, in Elliott wave analysis, means the relative position of a wave within the larger and smaller structures that make up the chart. R.N. Elliott, who in the 1930s developed the form of analysis that bears his name, viewed the chart as a complex structure of smaller waves nested within larger waves, which in turn are nested within still larger waves. In mathematics it’s called a fractal structure, where at every scale the pattern is similar to the others.
Learning and other resources. Elliott wave analysis provides context, not prophecy. As the 20th century semanticist Alfred Korzybski put it in his book Science and Sanity (1933), “The map is not the territory … The only usefulness of a map depends on similarity of structure between the empirical world and the map.” And I would add, in the ever-changing markets, we can judge that similarity of structure only after the fact.
See the menu page Analytical Methods for a rundown on where to go for information on Elliott wave analysis.
By Tim Bovee, Portland, Oregon, January 8, 2025
Disclaimer
Tim Bovee, Private Trader tracks the analysis and trades of a private trader for his own accounts. Nothing in this blog constitutes a recommendation to buy or sell stocks, options or any other financial instrument. The only purpose of this blog is to provide education and entertainment.
No trader is ever 100 percent successful in his or her trades. Trading in the stock and option markets is risky and uncertain. Each trader must make trading decisions for his or her own account, and take responsibility for the consequences.
License
All content on Tim Bovee, Private Trader by Timothy K. Bovee is licensed under a Creative Commons Attribution-ShareAlike 4.0 International License.
Based on a work at www.timbovee.com.


You must be logged in to post a comment.