Weekend study. Over the weekend I developed a rule set for using HYG, an ETF tracking high-risk corporate bonds, as a buy and sell signal suitable for trading short vertical options spreads, based on the idea that the high-risk bonds’ pricing provides an insight into trader’s willingness to take on risk. Read about it here.
3:30 p.m. New York time
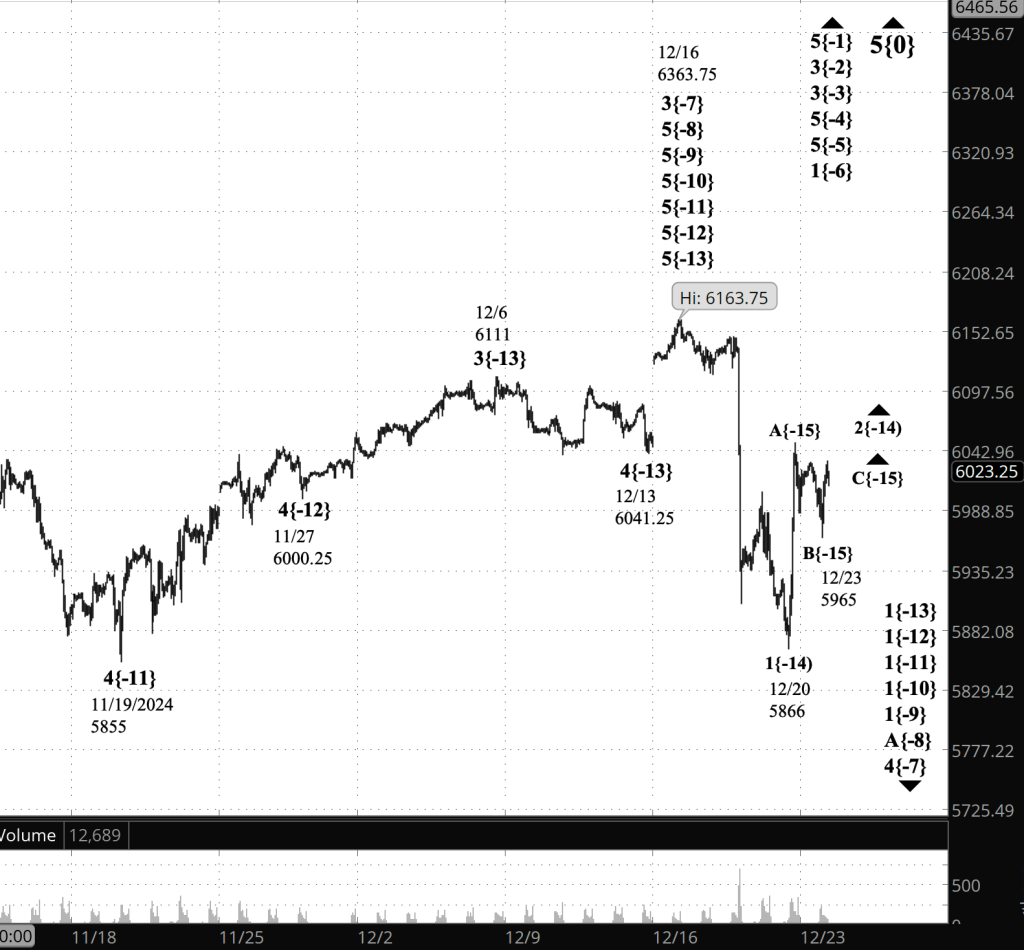
Half an hour before the closing bell. The S&P 500 futures reversed to the upside during the session. Elliott Wave Theory: The reversal point, 5965, ended declining wave B and began rising wave C, the final subwave in the 2nd-wave upward correction that began on December 20.
An ambiguity. It’s possible that the reversal is a subwave withib an ongoing wave B, which has not ended. Under this scenario, wave C has yet to begin,
9:35 a.m. New York time
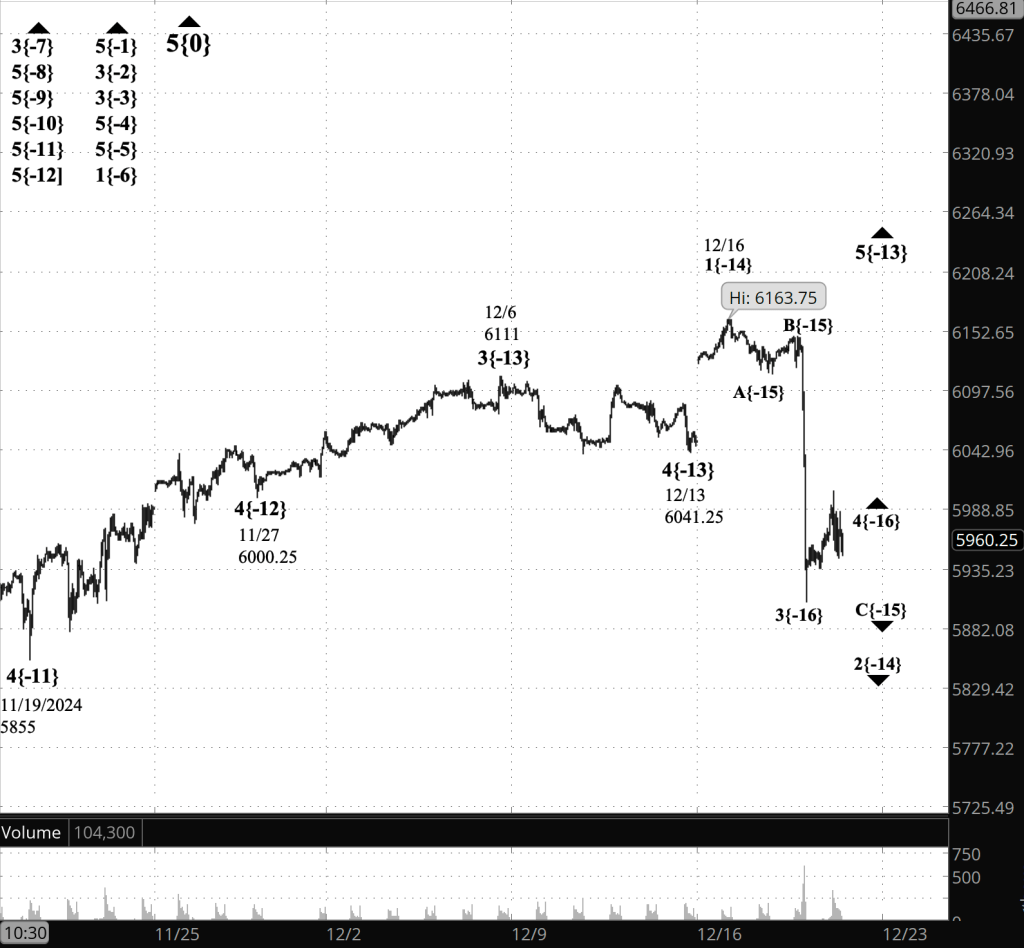
What’s happening now? The S&P 500 E-mini futures decline after trading resumed overnight, from the 6030s to the 5980s as the opening bell approached.
What does it mean? In Elliott Wave Theory, a small 2nd-wave downward correction is underway, a subwave within a larger declining 1st wave that began December 16. That parent wave is part of a series of 1st waves following the end of a nested series of rising 5th waves covering six degrees within the fractal structure of the chart.
[S&P 500 E-mini futures at 9:35 a.m., hourly bars, with volume]
What are the alternatives? Ambiguities always appear, just not yet.
What does Elliott wave theory say? Here are the waves that underly the analyses.
Principal Analysis:
- Rising wave 5{0} is underway. It is a wave of Intermediate degree that began in December 2018.
- It is in its final subwave, wave 5{-1}.
- Within wave 5{-1}, rising waves 5{-2}, 5{-3} and 5{-4} are underway, as is wave 5{-5}.
- Wave 5{-5} is in its initial subwave, wave 1{-6}, which in turn is in its middle subwave, wave 3{-7}.
- Wave 4{-7} is in its initial; subwave, uptrending wave A{-8}.
- Wave 1{-8} is in its initial subwave, wave 1{-9}, which is in its final subwave, uptrending wave 5{-10}.
- Wave 1{-10} is in its initial subwave, as are waves 1{-11}, 1{-12}, and 1{-13}.
- Wave 2{-14} appears to be underway and is in its initial subwave, wave A{-15}.
Long-term Waves.
These are the waves currently in progress under my principal analysis. Each line on the list shows the wave number, with the subscript in curly brackets, the traditional degree name, the starting date, the starting price of the S&P 500 E-mini futures, and the direction of the wave.
- S&P 500 Index:
- 5{+3} Supercycle, 7/8/1932, 4.40 (up)
- 5{+2} Cycle, 12/9/1974, 60.96 (up)
- 5{+1} Primary, 3/6/2009, 666.79 (up)
- 5{0} Intermediate, 12/26/2018, 2346.58 (up)
- S&P 500 Futures
- 5{-1} Minor, 10/27/2023, 4127.25 (up)
- 3{-2} Minute, 10/27/23, 4127.75 (up)
- 3{-3} Minuette, 10/27/23, 4127.75 (up)
- 5{-4} Subminuette, 4/18/2024, 4963.50 (up)
- 5{-5} Micro, 8/5/2024, 5120 (up)
- 1{-6} Submicro, 8/5/2024, 5120 (up)
- 4{-7} Minuscule, 12/16/2024, 6163.75 (down)
- A{-8} (unnamed), 12/16/2024, 6163.75 (down)
- 1{-9} (unnamed), 12/16/2024, 6163.75 (down)
- 1{-10} (unnamed), 12/16/2024, 6163.75 (down)
- 1{-11} (unnamed), 12/16/2024, 6163.75 (down)
- 1{-12} (unnamed), 12/16/2024, 6163.75 (down)
- 1{-13} (unnamed), 12/16/2024, 6163.75 (down)
- 2[-14} (unnamed), 12/20/2024, 5866 (up)
- B{-15} (unnamed), 12/20/2024, 5866 (up)
Reading the chart. Price movements — waves – – in Elliott wave analysis are labeled with numbers within trending waves and letters with corrective waves. The subscripts — numbers in curly brackets — designate the wave’s degree, which, in Elliott wave analysis, means the relative position of a wave within the larger and smaller structures that make up the chart. R.N. Elliott, who in the 1930s developed the form of analysis that bears his name, viewed the chart as a complex structure of smaller waves nested within larger waves, which in turn are nested within still larger waves. In mathematics it’s called a fractal structure, where at every scale the pattern is similar to the others.
Learning and other resources. Elliott wave analysis provides context, not prophecy. As the 20th century semanticist Alfred Korzybski put it in his book Science and Sanity (1933), “The map is not the territory … The only usefulness of a map depends on similarity of structure between the empirical world and the map.” And I would add, in the ever-changing markets, we can judge that similarity of structure only after the fact.
See the menu page Analytical Methods for a rundown on where to go for information on Elliott wave analysis.
By Tim Bovee, Portland, Oregon, December 23, 2024
Disclaimer
Tim Bovee, Private Trader tracks the analysis and trades of a private trader for his own accounts. Nothing in this blog constitutes a recommendation to buy or sell stocks, options or any other financial instrument. The only purpose of this blog is to provide education and entertainment.
No trader is ever 100 percent successful in his or her trades. Trading in the stock and option markets is risky and uncertain. Each trader must make trading decisions for his or her own account, and take responsibility for the consequences.
License
All content on Tim Bovee, Private Trader by Timothy K. Bovee is licensed under a Creative Commons Attribution-ShareAlike 4.0 International License.
Based on a work at www.timbovee.com.


You must be logged in to post a comment.