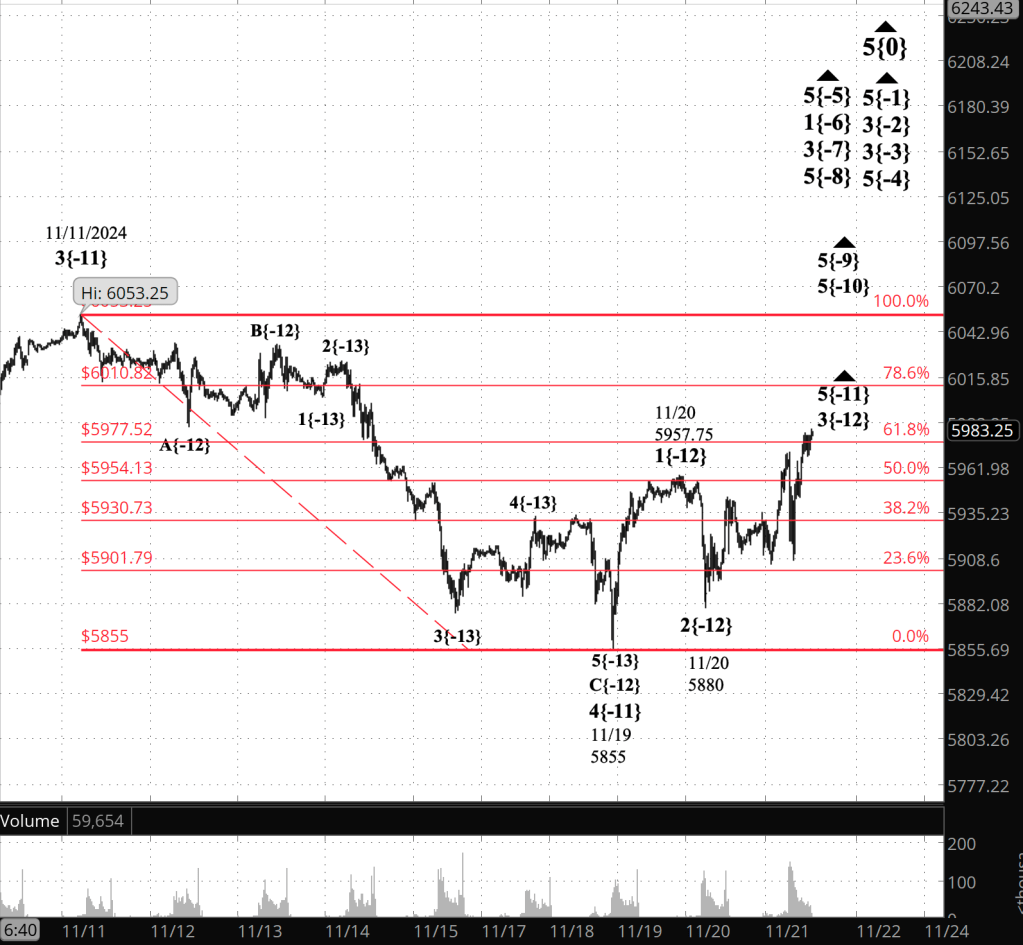
3:30 p.m. New York time
Half an hour before the closing bell. The S&P 500 futures rose to 6040 early in the session and then reversed, reaching into the 5980s.
Elliott Wave Theory: The 6040 peak was the end of the small 3rd wave buried three levels deep within the 5th-wave uptrend that began on November 19. A small 4th-wave downward correction began at that point and is now underway.
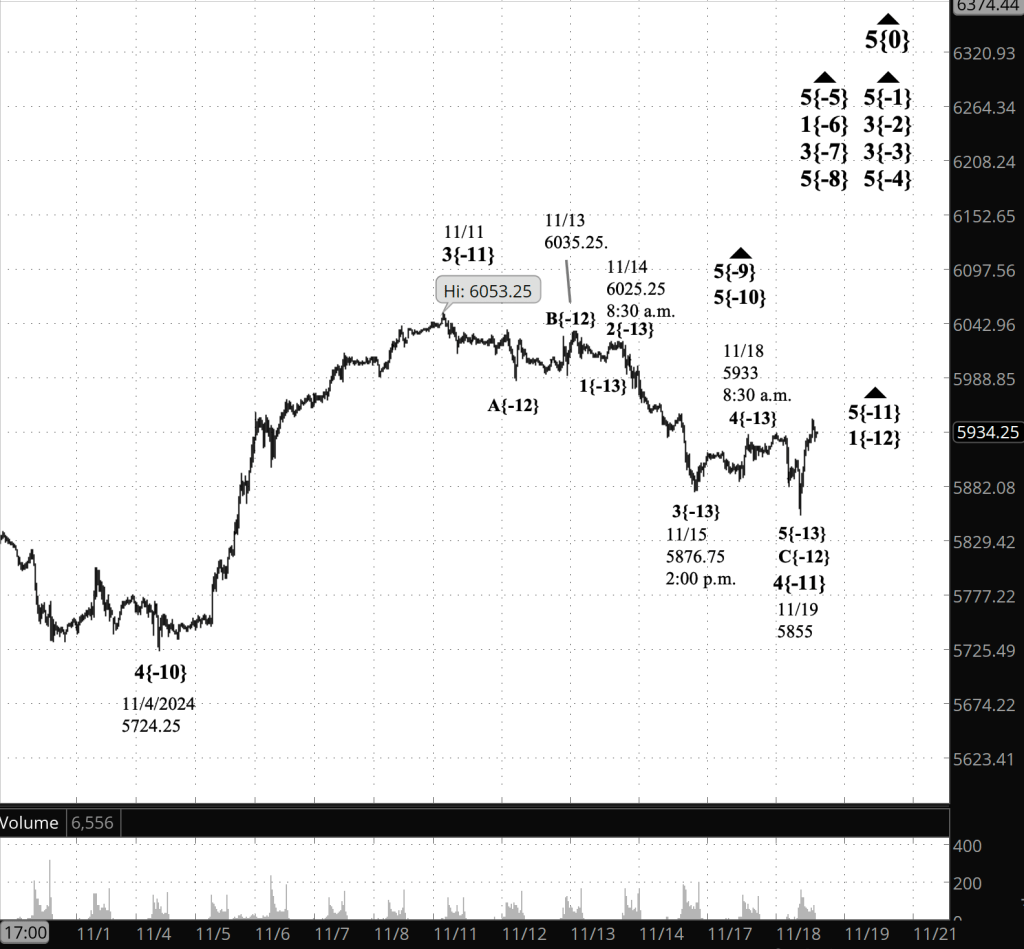
9:35 a.m. New York time
What’s happening now? The S&P 500 E-mini futures gapped higher when trading resumed overnight. The rise continued, reaching into the 6030s as the opening bell approached.
What does it mean? The leap carried the price to the 78.6% Fibonacci retracement level, the final level below 100%. Elliott Wave Theory applied to the chart indicates that the 5th-wave uptrend, which began on November 19, is currently in its 3rd of five subwaves. This subwave, in turn, is within its smaller 5th subwave.
Looking at the broader context, the largest wave in play—the 5th wave that started on November 19—is approaching completion. Once finished, it will also mark the end of its parent wave, another 5th wave of a larger degree.
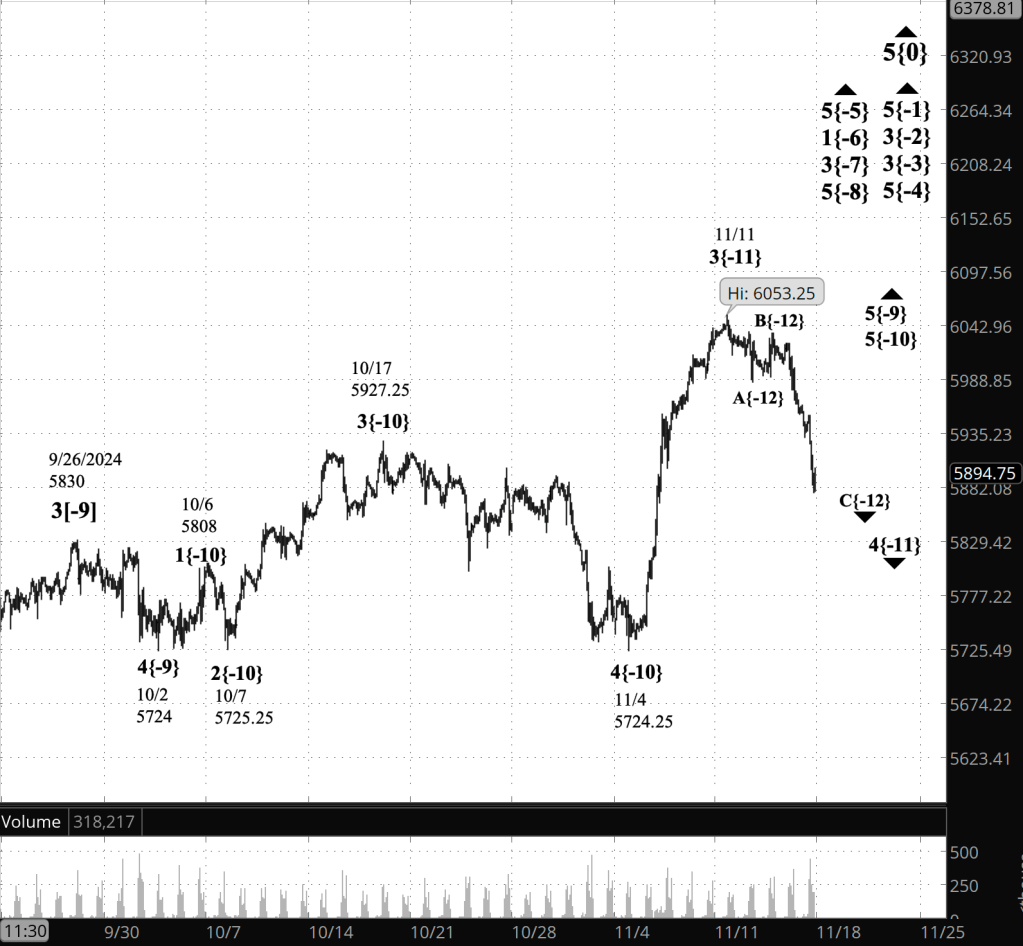
At the top of the fractal structure is a rising 3rd wave that began on August 7 from 5192. This wave will conclude simultaneously with the smaller 5th waves, ushering in a significant 4th-wave downward correction.
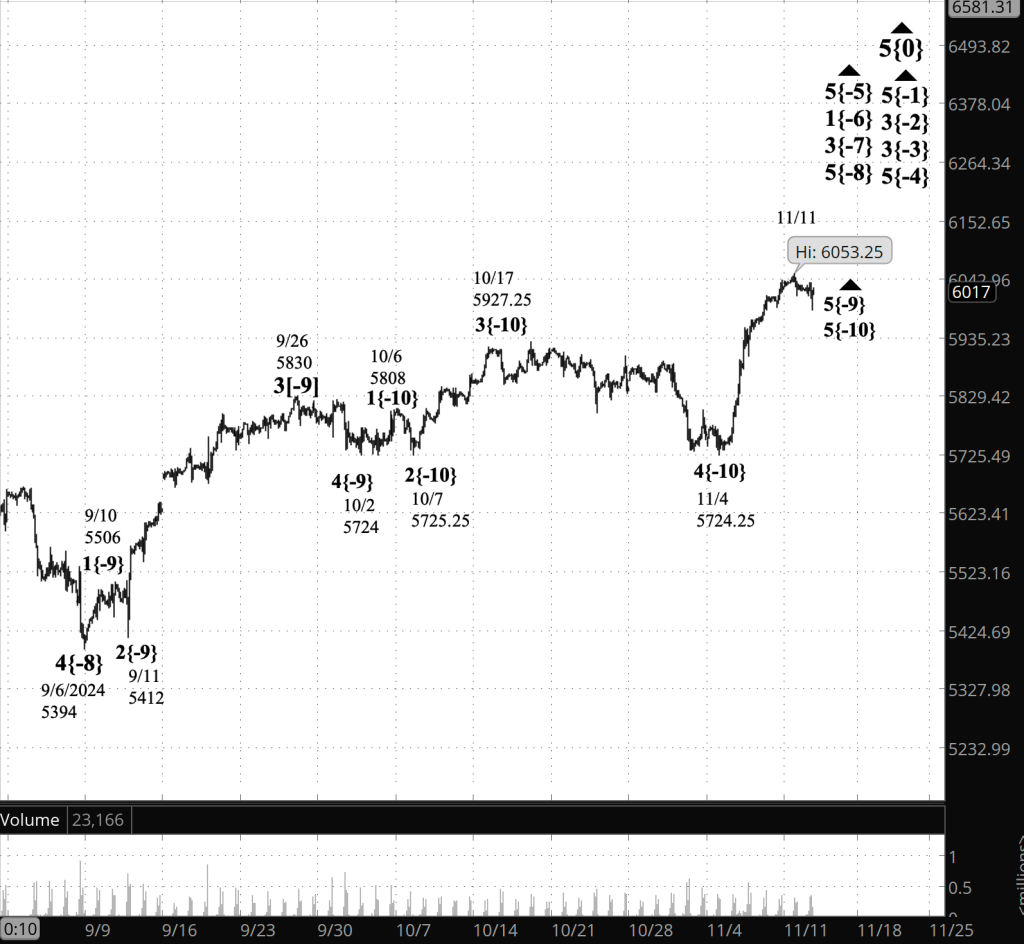
The Question of the Moment: How High Can It Go? Fifth waves typically retrace the entirety of the preceding 4th wave, reaching the 100% Fibonacci level. In some cases, the 5th wave can move significantly beyond the start of wave 4, which in this instance is at 6053.25. However, in Elliott Wave Theory, 5th waves are often unpredictable, leaving their ultimate endpoint a puzzle.

[S&P 500 E-mini futures at 3:30 p.m., 25-minute bars, with volume]
What are the alternatives? None at present, and typically some will develop.
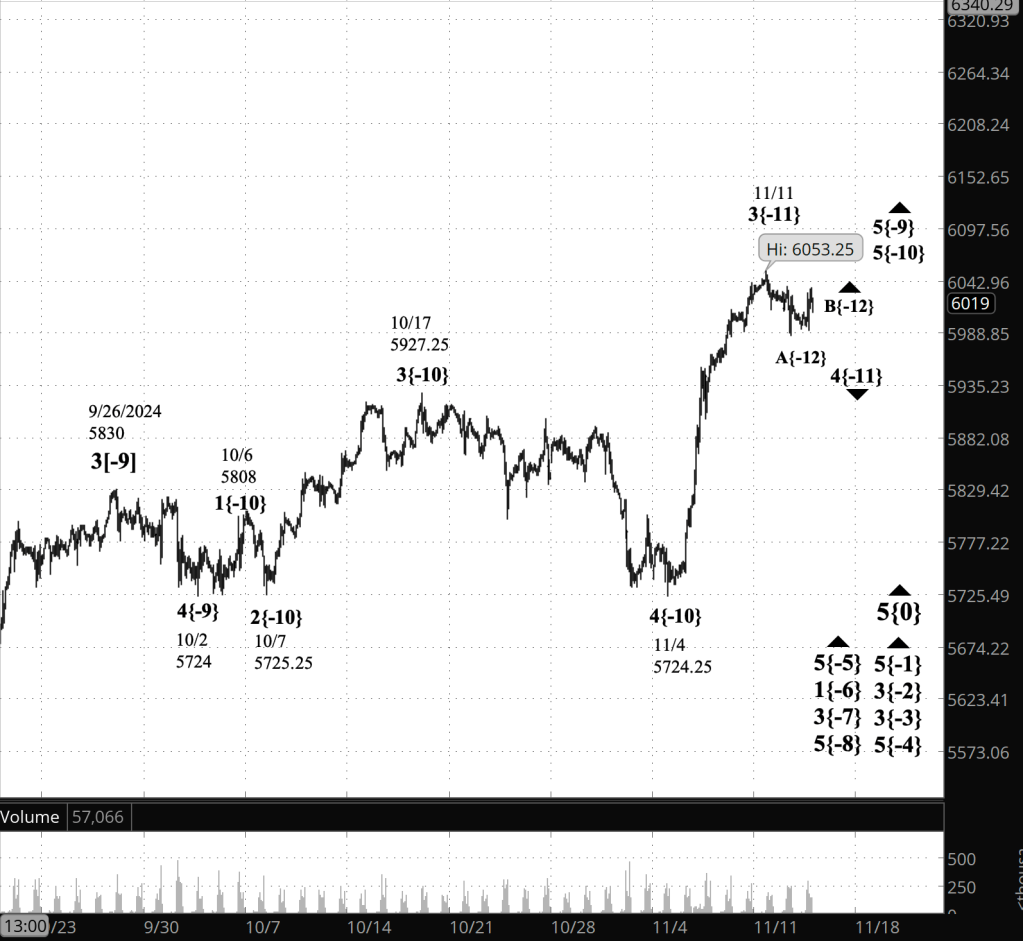
What does Elliott wave theory say? Here are the waves that underly the analyses.
Principal Analysis:
- .Rising wave 5{0} is underway. It is a wave of Intermediate degree that began in December 2018.
- It is in its final subwave, wave 5{-1}.
- Within wave 5{-1}, rising waves 5{-2}, 5{-3} and 5{-4} are underway, as is wave 5{-5}.
- Wave 5{-5} is in its initial subwave, wave 1{-6}, which in turn is in its middle subwave, wave 3{-7}.
- Wave 3{-7} is in its final; subwave, uptrending wave 5{-8}.
- Wave 5{-8} is in its final subwave, wave 5{-9}, which is in its final subwave, uptrending wave 5{-10}.
- Wave 5{-10} is in its final subwave, wave 5{-11}, which is in its middle subwave, wave 3{-12}, within wave 5{-13}.
Long-term Waves.
These are the waves currently in progress under my principal analysis. Each line on the list shows the wave number, with the subscript in curly brackets, the traditional degree name, the starting date, the starting price of the S&P 500 E-mini futures, and the direction of the wave.
- S&P 500 Index:
- 5{+3} Supercycle, 7/8/1932, 4.40 (up)
- 5{+2} Cycle, 12/9/1974, 60.96 (up)
- 5{+1} Primary, 3/6/2009, 666.79 (up)
- 5{0} Intermediate, 12/26/2018, 2346.58 (up)
- S&P 500 Futures
- 5{-1} Minor, 10/27/2023, 4127.25 (up)
- 3{-2} Minute, 10/27/23, 4127.75 (up)
- 3{-3} Minuette, 10/27/23, 4127.75 (up)
- 5{-4} Subminuette, 4/18/2024, 4963.50 (up)
- 5{-5} Micro, 8/5/2024, 5120 (up)
- 1{-6} Submicro, 8/5/2024, 5120 (up)
- 3{-7} Minuscule, 8/7/2024, 5182 (up)
- 5{-8} (unnamed), 9/6/2024, 5394 (up)
- 5{-9} (unnamed), 10/2/2024, 5724 (up)
- 5{-10} (unnamed), 11/4/2024, 5824.25 (up)
- 5{-11} (unnamed), 11/19/2024, 5933 (up)
Reading the chart. Price movements — waves – – in Elliott wave analysis are labeled with numbers within trending waves and letters with corrective waves. The subscripts — numbers in curly brackets — designate the wave’s degree, which, in Elliott wave analysis, means the relative position of a wave within the larger and smaller structures that make up the chart. R.N. Elliott, who in the 1930s developed the form of analysis that bears his name, viewed the chart as a complex structure of smaller waves nested within larger waves, which in turn are nested within still larger waves. In mathematics it’s called a fractal structure, where at every scale the pattern is similar to the others.
Learning and other resources. Elliott wave analysis provides context, not prophecy. As the 20th century semanticist Alfred Korzybski put it in his book Science and Sanity (1933), “The map is not the territory … The only usefulness of a map depends on similarity of structure between the empirical world and the map.” And I would add, in the ever-changing markets, we can judge that similarity of structure only after the fact.
See the menu page Analytical Methods for a rundown on where to go for information on Elliott wave analysis.
By Tim Bovee, Portland, Oregon, November 25, 2024
Disclaimer
Tim Bovee, Private Trader tracks the analysis and trades of a private trader for his own accounts. Nothing in this blog constitutes a recommendation to buy or sell stocks, options or any other financial instrument. The only purpose of this blog is to provide education and entertainment.
No trader is ever 100 percent successful in his or her trades. Trading in the stock and option markets is risky and uncertain. Each trader must make trading decisions for his or her own account, and take responsibility for the consequences.
License
All content on Tim Bovee, Private Trader by Timothy K. Bovee is licensed under a Creative Commons Attribution-ShareAlike 4.0 International License.
Based on a work at www.timbovee.com.


You must be logged in to post a comment.