Market holiday. U.S. markets will be closed on Monday for the Labor Day holiday, the traditional end of the summer vacation season. The S&P 500 futures will resume trading overnight and Tuesday’s markets will follow their normal schedules.
3:30 p.m. New York time
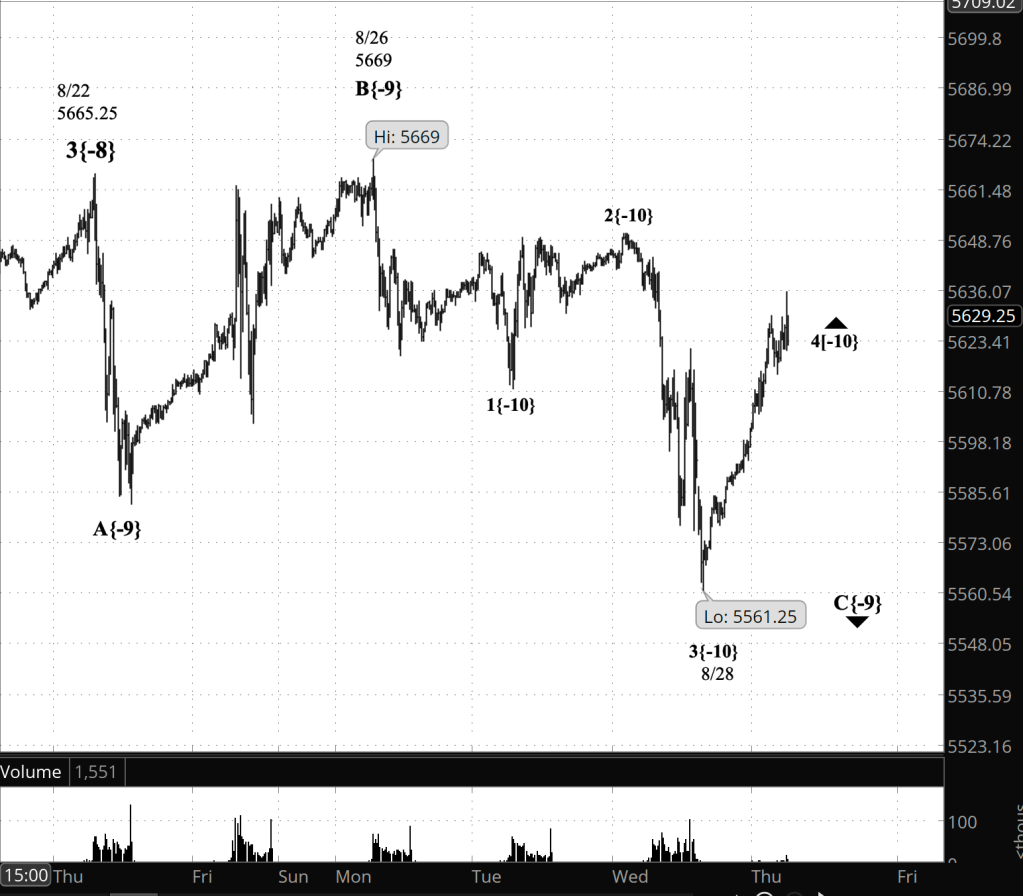
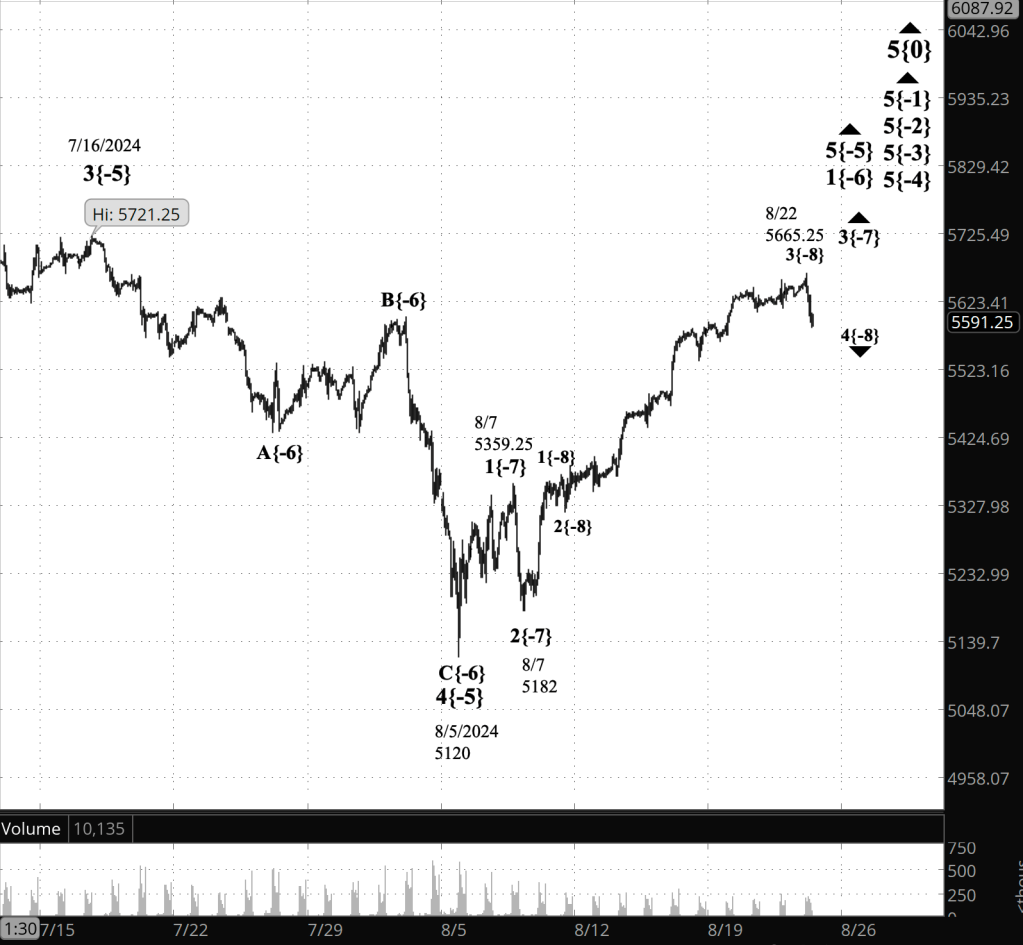
Half an hour before the closing bell. The S&P 500 futures traded net-sideways during the session, remaining between the 5640s and the 5590s. Elliott Wave Theory: The 4th-wave downward correction continues to work through what is most likely its endgame, assuming a typical pattern rather than one of the less common varieties.
Several economic eports that sometimes move markets will be released after trading resumes next week: Job openings, Factory Orders and the Federal Reserve’s Beige Book on Wednesday. On Thursday, the ADP sneak peak at the government’s jobs report. And the big one on Friday, the Employment Situation report, with the government’s employment and unemployment figures, key to the Federal Open Market Committee’s rate-setting next month, and also the Sahm Rule, an early-warning system that signaled the start of recession last month, prompting much skepticism among economists.
9:35 a.m. New York time
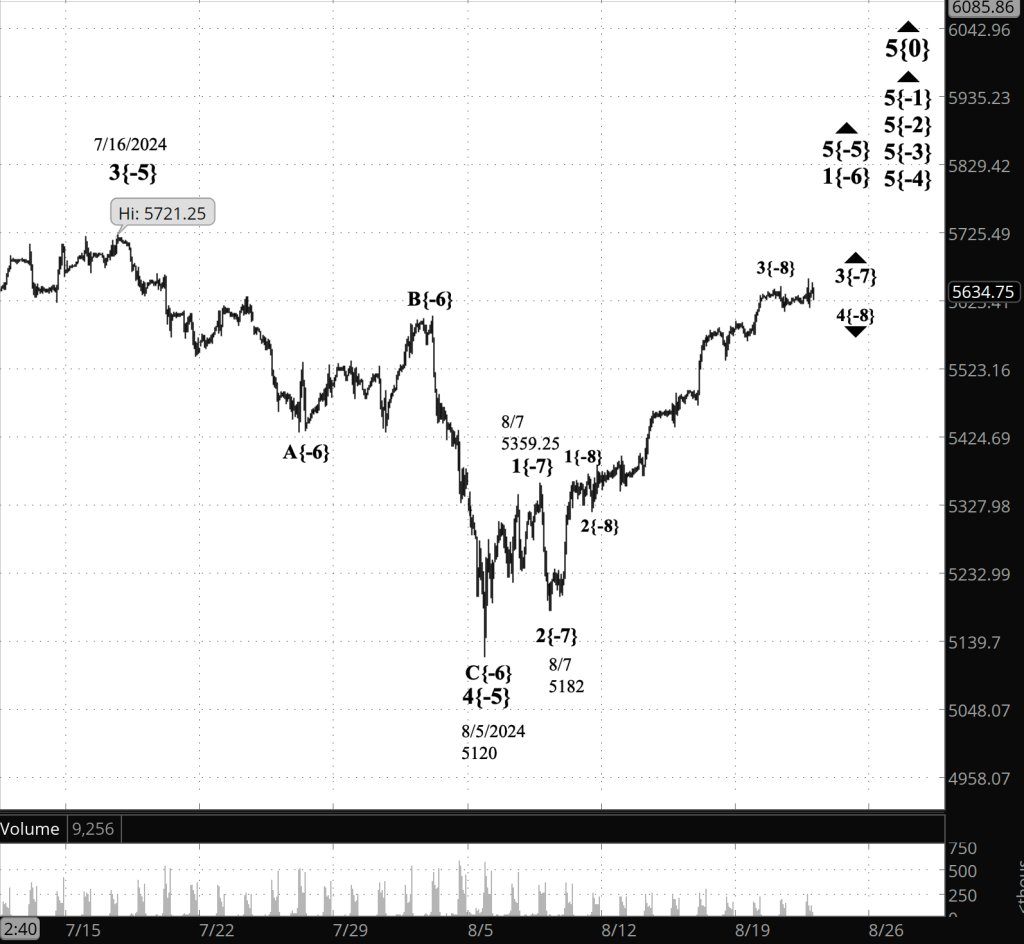
What’s happening now? The S&P 500 E-mini futures rose overnight, from slightly below 5610 into the 5630s.
What does it mean? Elliott Wave Theory sees the rise as a counter-trend move within the final subwave — falling wave 5 — within the larger final subwave — falling wave C — within the low-degree 4th wave downward corrective pattern that began on August 22.
When wave 5 is complete, it will also be the end of the larger wave C and, if the correction is typical, the still larger wave 4. See the “What happens next?” section Tuesday, August 27 Trader’s Notebook for a description of ways the correction could extend in a compound form containing multiple corrective patterns.
The 4th-wave downward correction will be followed by a 5th-wave uptrend that will, if typical, carry the price into the 5670s and beyond.

[S&P 500 E-mini futures at 3:30 p.m., 80-minute bars, with volume]
What are the alternatives? None at present. Without a doubt, new alternatives will develop.
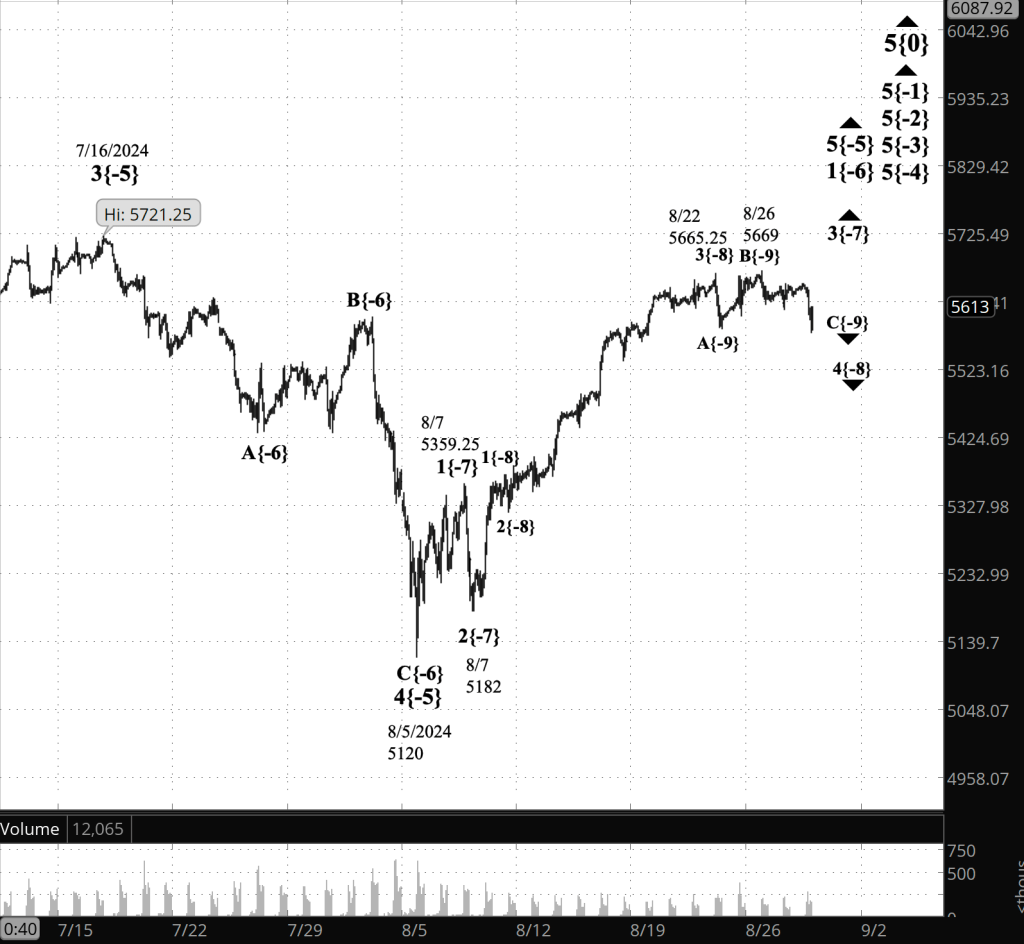
What does Elliott wave theory say? Here are the waves that underly the analyses.
Principal Analysis:
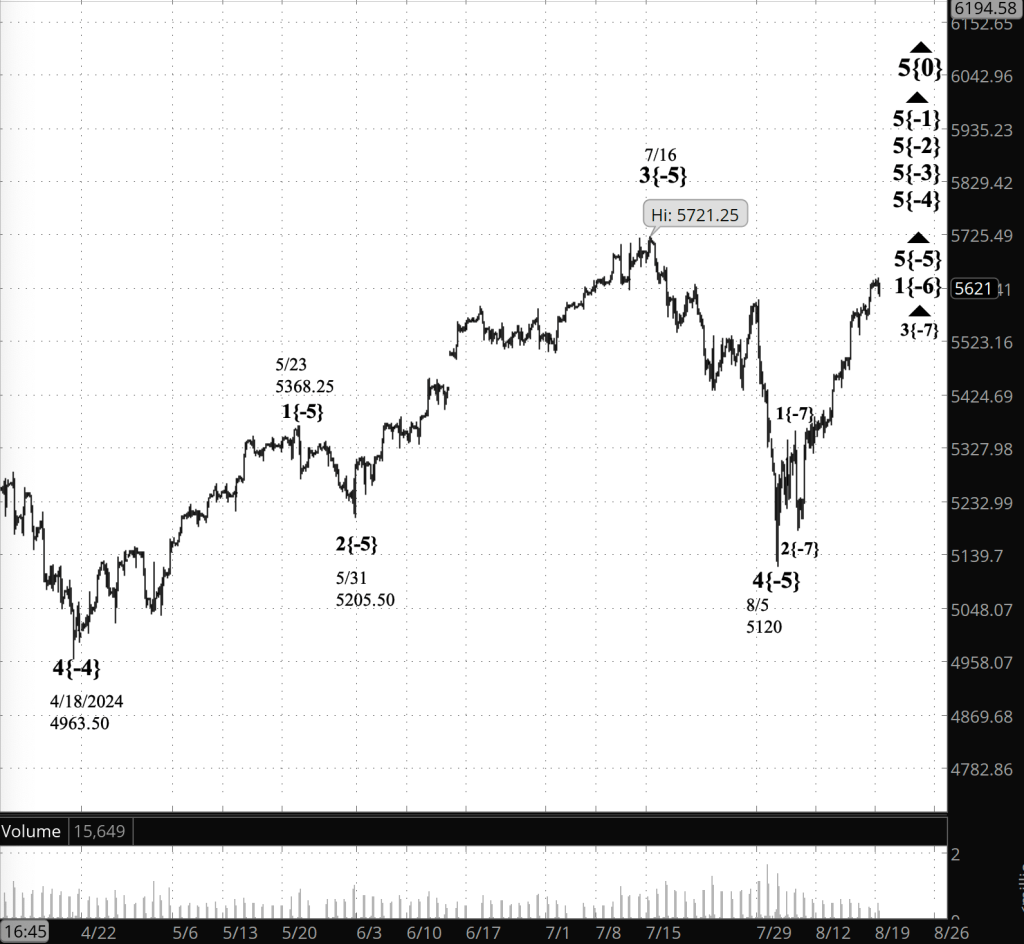
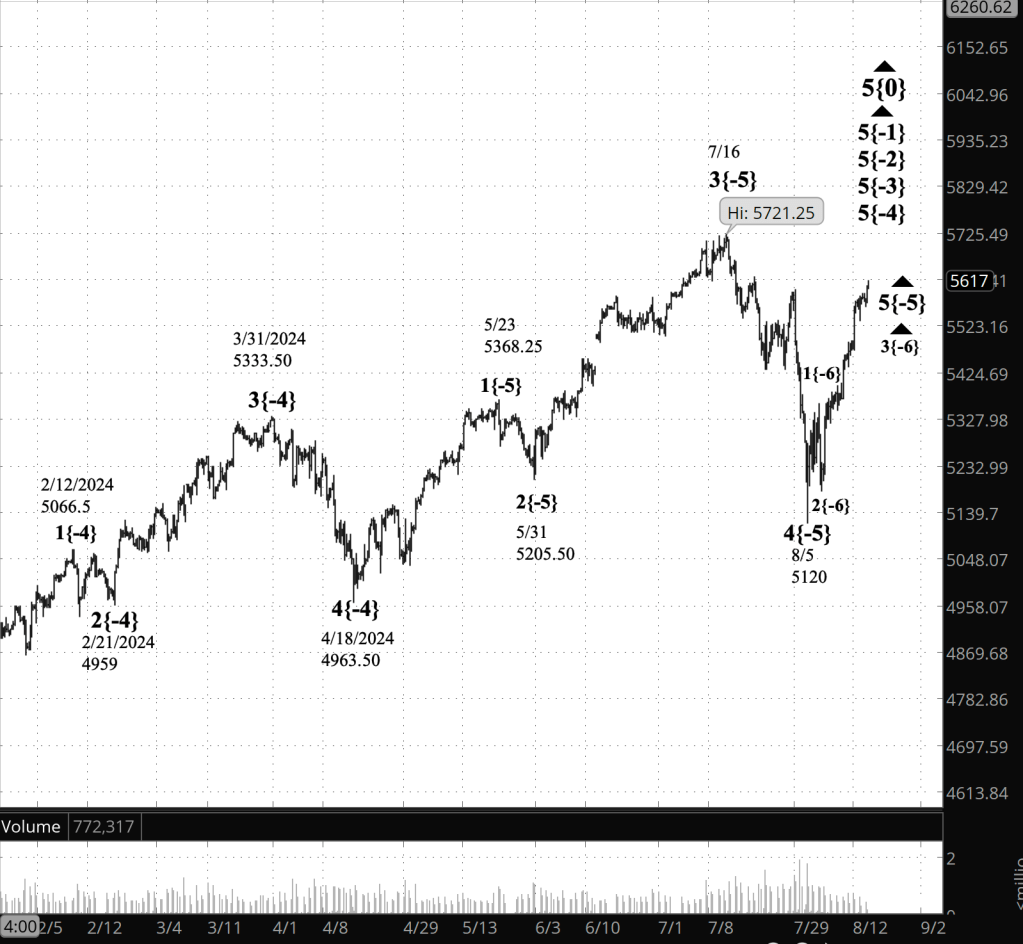
- Rising wave 5{0} is underway. It is a wave of Intermediate degree that began in December 2018.
- It is in its final subwave, wave 5{-1}.
- Within wave 5{-1}, rising waves 5{-2}, 5{-3} and 5{-4} are underway, as is wave 5{-5}.
- Wave 5{-5} is in its initial subwave, wave 1{-6}, which in turn is in its middle subwave, wave 3{-7}.
- Wave 3{-7} is in its next-to-the-last subwave, wave 4{-8}, a downward correction.
- Wave 4{-8} is in its final subwave, wave C{-9}.
Reading the chart. Price movements — waves – – in Elliott wave analysis are labeled with numbers within trending waves and letters with corrective waves. The subscripts — numbers in curly brackets — designate the wave’s degree, which, in Elliott wave analysis, means the relative position of a wave within the larger and smaller structures that make up the chart. R.N. Elliott, who in the 1930s developed the form of analysis that bears his name, viewed the chart as a complex structure of smaller waves nested within larger waves, which in turn are nested within still larger waves. In mathematics it’s called a fractal structure, where at every scale the pattern is similar to the others.
Learning and other resources. Elliott wave analysis provides context, not prophecy. As the 20th century semanticist Alfred Korzybski put it in his book Science and Sanity (1933), “The map is not the territory … The only usefulness of a map depends on similarity of structure between the empirical world and the map.” And I would add, in the ever-changing markets, we can judge that similarity of structure only after the fact.
See the menu page Analytical Methods for a rundown on where to go for information on Elliott wave analysis.
By Tim Bovee, Portland, Oregon, August 30, 2024
Disclaimer
Tim Bovee, Private Trader tracks the analysis and trades of a private trader for his own accounts. Nothing in this blog constitutes a recommendation to buy or sell stocks, options or any other financial instrument. The only purpose of this blog is to provide education and entertainment.
No trader is ever 100 percent successful in his or her trades. Trading in the stock and option markets is risky and uncertain. Each trader must make trading decisions for his or her own account, and take responsibility for the consequences.
License
All content on Tim Bovee, Private Trader by Timothy K. Bovee is licensed under a Creative Commons Attribution-ShareAlike 4.0 International License.
Based on a work at www.timbovee.com.


You must be logged in to post a comment.