Trader’s Notebook

3:30 p.m. New York time

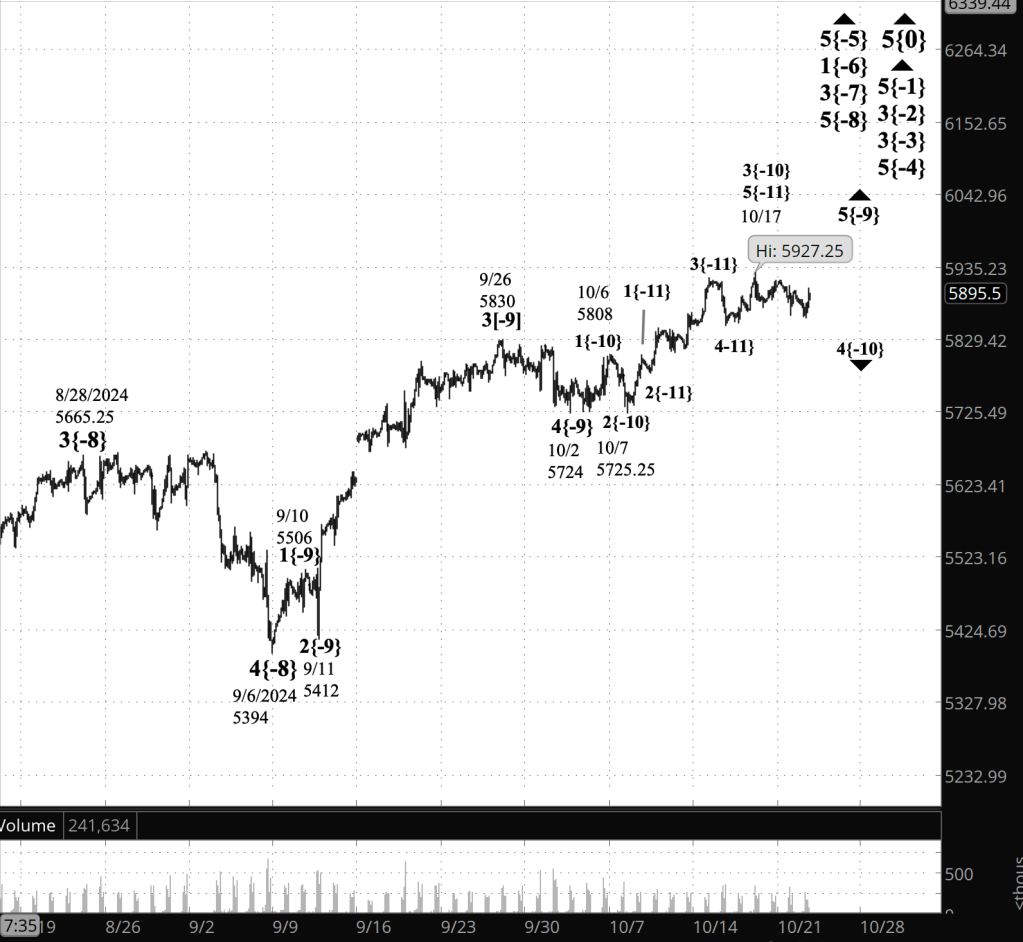
Half an hour before the closing bell. The S&P 500 futures has spent the session so far with the overnight range: from the 5860s to the 5880s. This morning’s analysis stands.

9:35 a.m. New York time

What’s happening now? The S&P 500 E-mini futures worked its way sideways after trading resumed overnight, beginning in the 5850s and thereafter fluctuating from the 5860s to the 5880s.

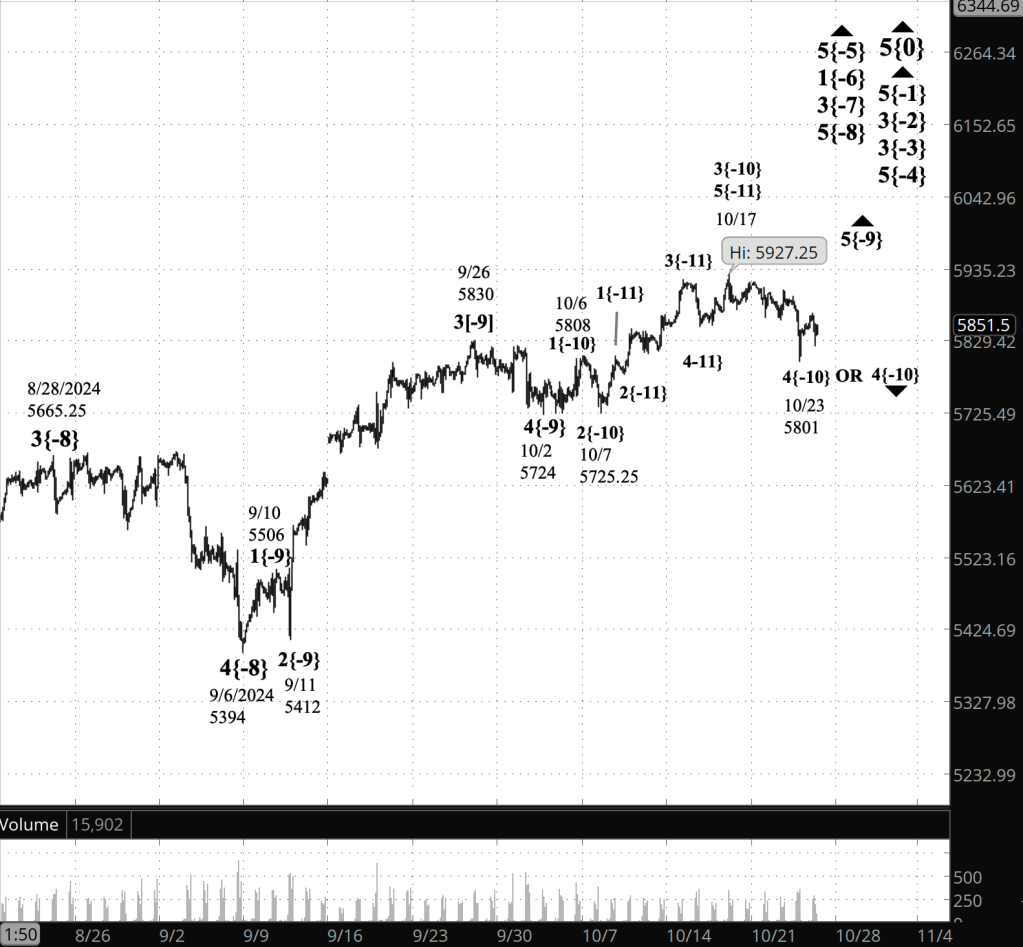
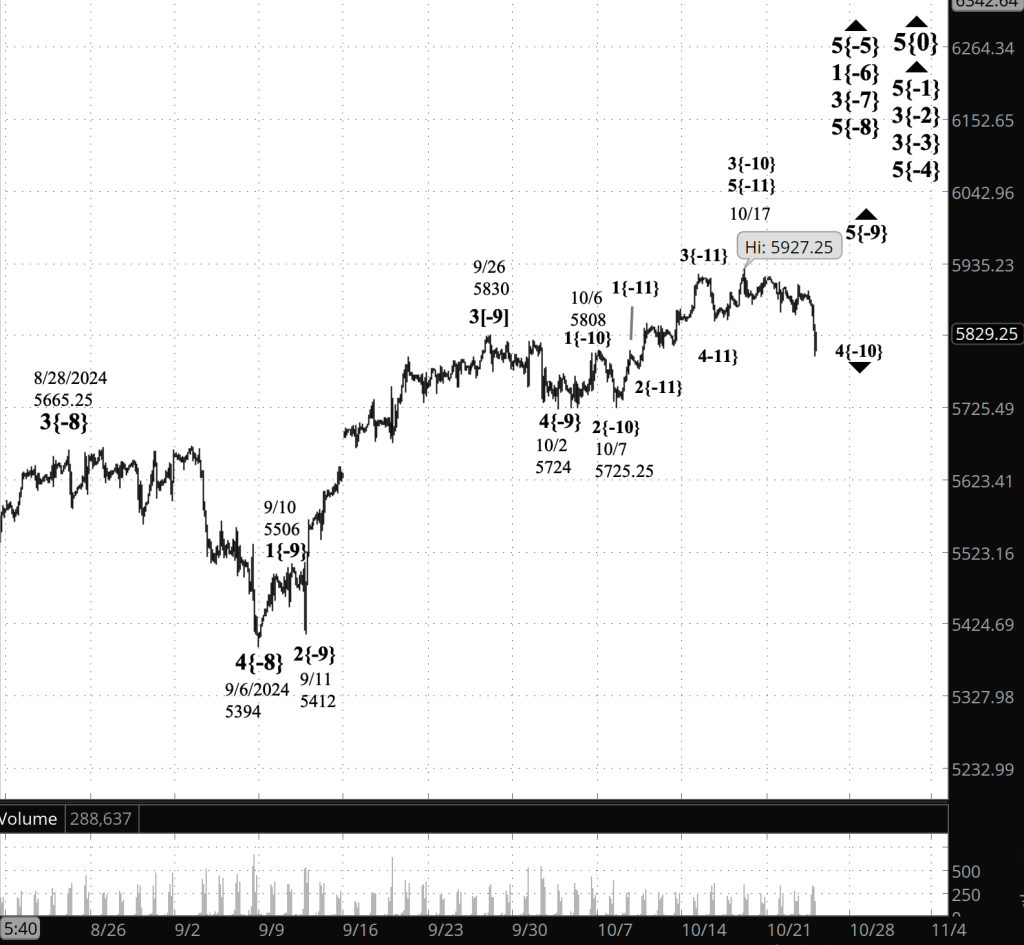
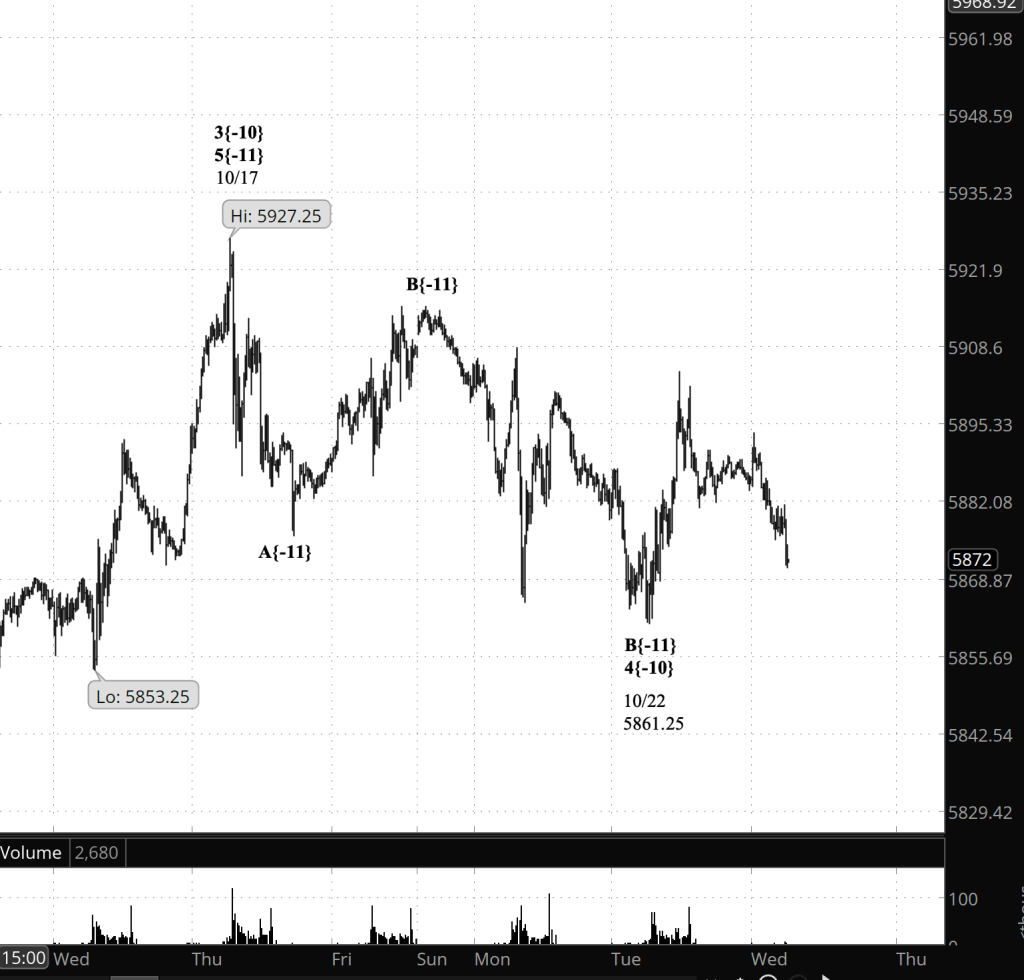
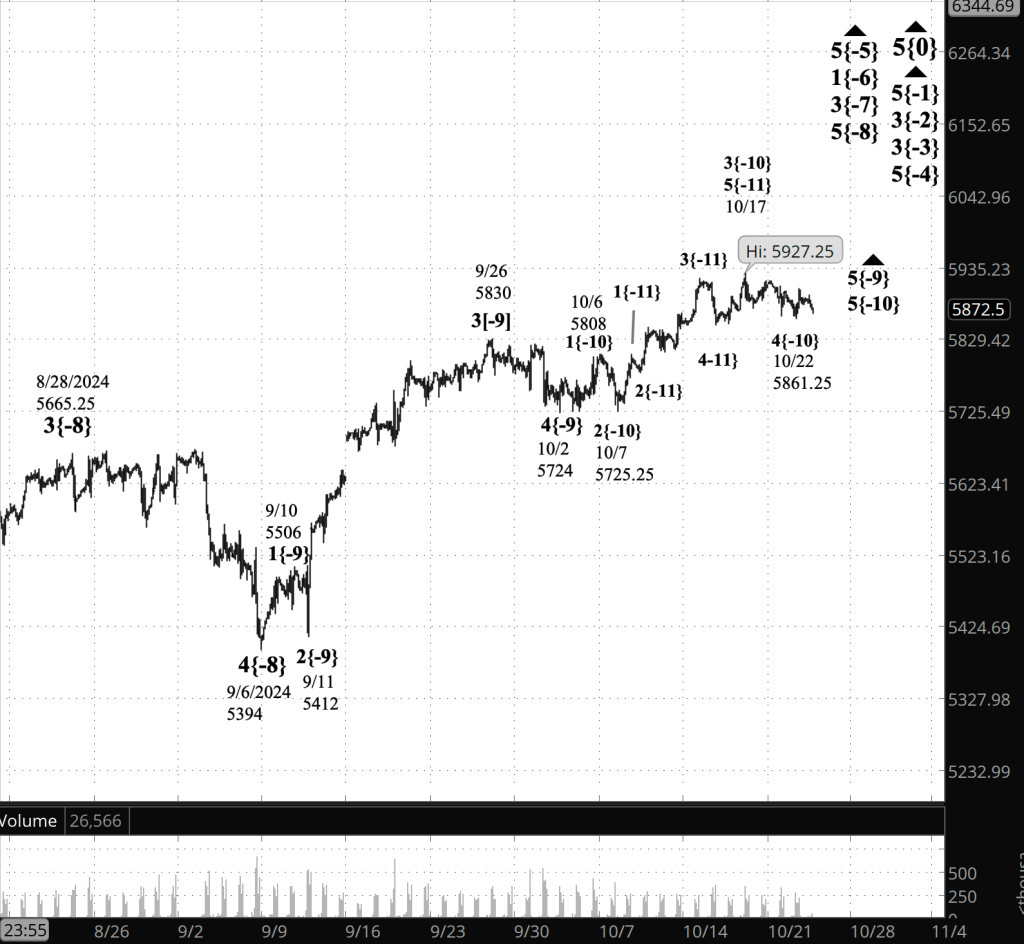
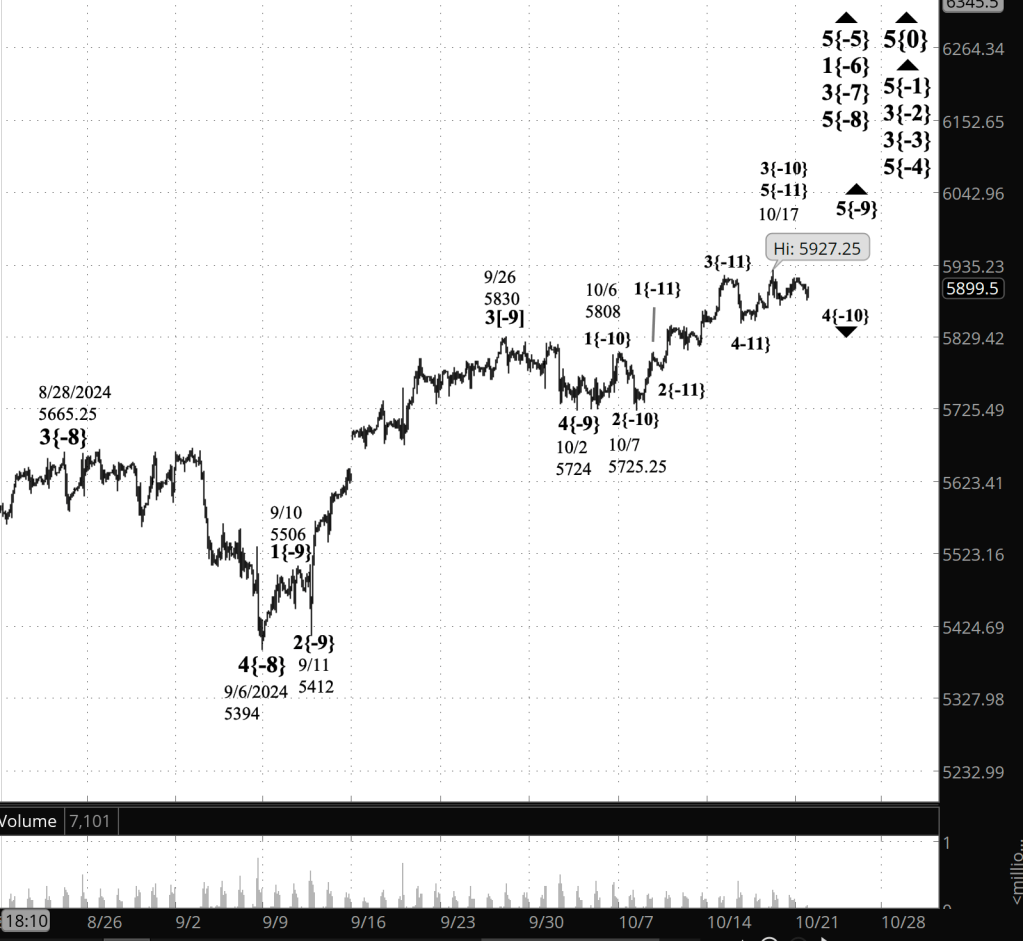
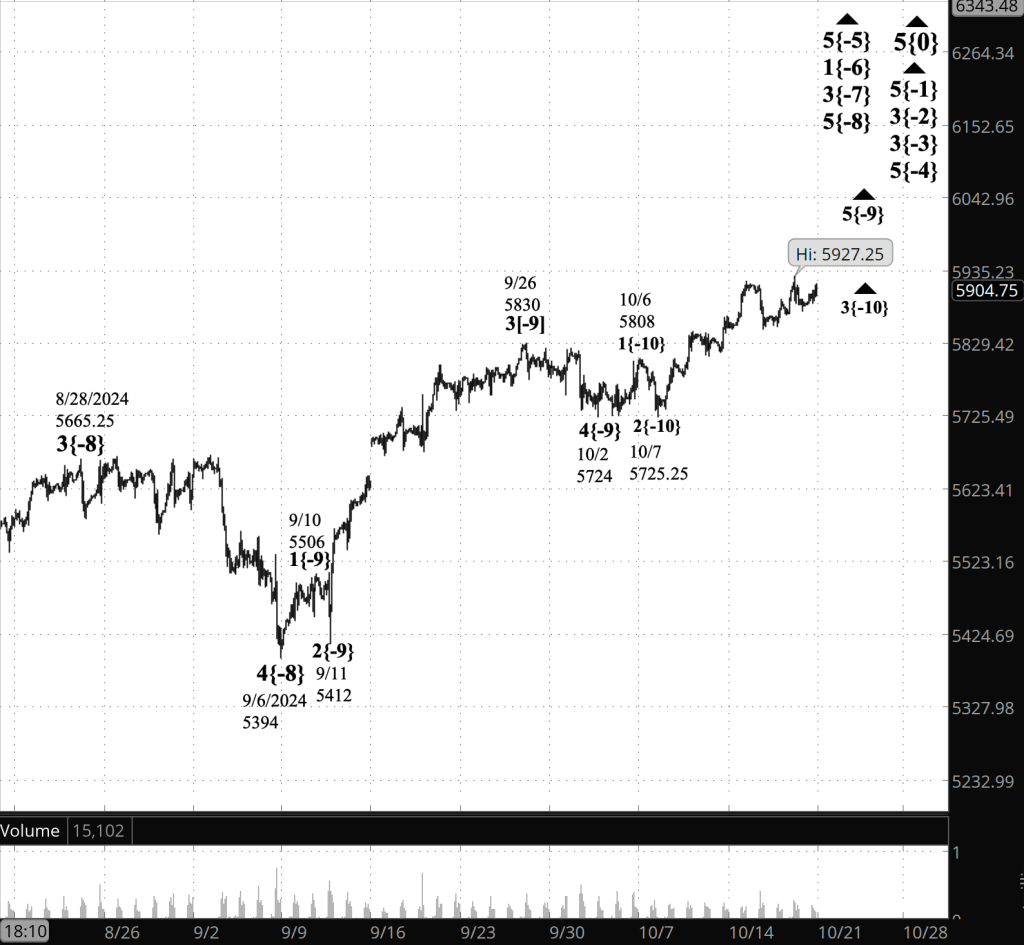
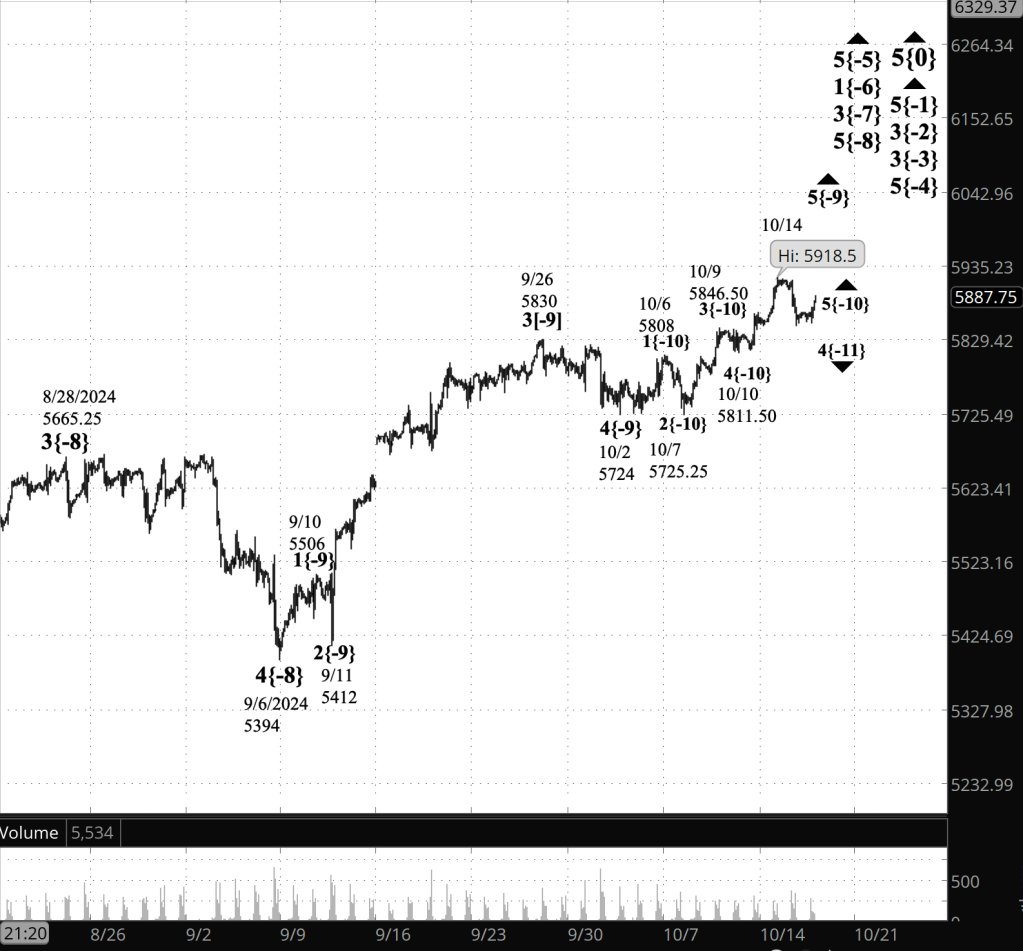
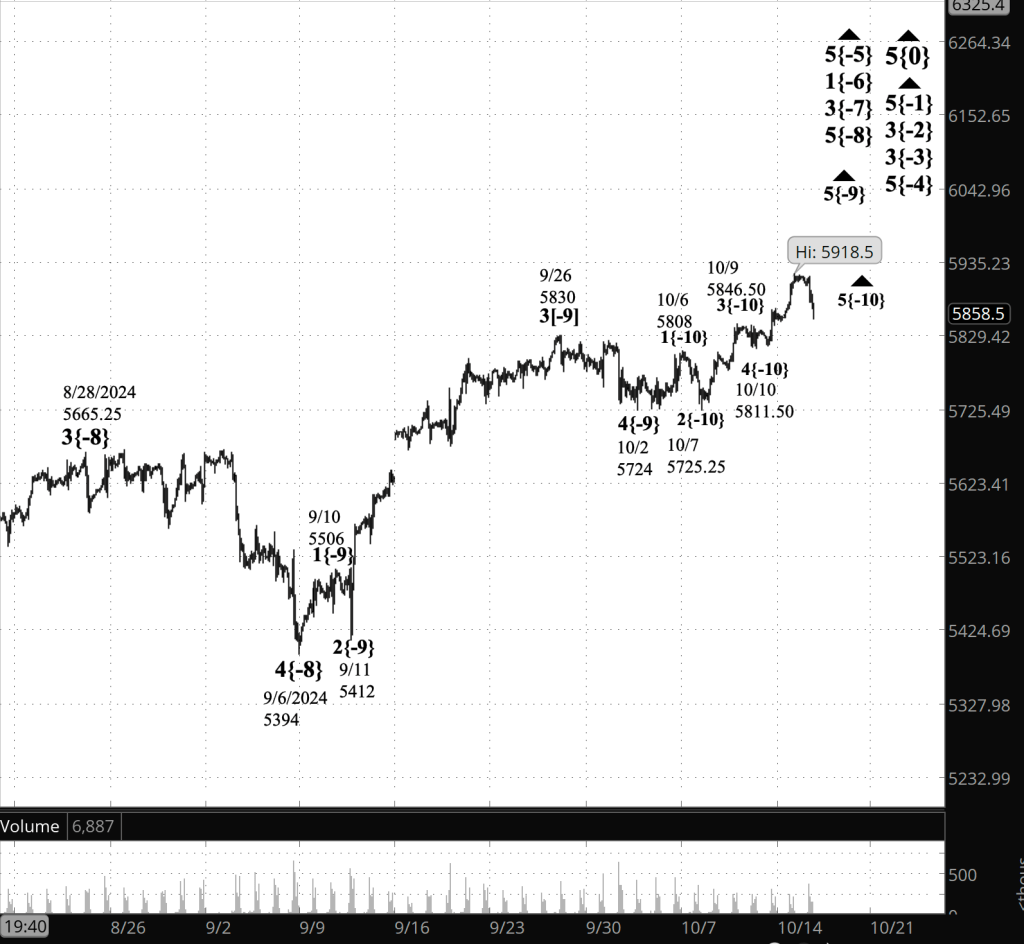
What does it mean? The structure of the chart, based on Elliott Wave Theory, little changed from the end of last week. That a 4th-wave downward correction began began on October 17 is clear. What’s unclear is whether that 4th wave has ended or is stil in progress.

As I have in the past few days, I’ve labeled the chart with both alternatives: Either the correction ended on October 27 at 5801, or that point was the end of the first subwave of the correction, wave A. There will be a lack of clarity until there’s a breakout above 5927.25 (wave 4 has ended) or below 5801 (wave 4 continues).

[S&P 500 E-mini futures at 3:30 p.m., 90-minute bars, with volume]

What are the alternatives? See the discussion above for the alternative analyses. There is no principal analysis.

What does Elliott wave theory say? Here are the waves that underly the analyses.

Principal Analysis:

  • None.

Alternative Analysis #1:

  • Rising wave 5{0} is underway. It is a wave of Intermediate degree that began in December 2018.
  • It is in its final subwave, wave 5{-1}.
  • Within wave 5{-1}, rising waves 5{-2}, 5{-3} and 5{-4} are underway, as is wave 5{-5}.
  • Wave 5{-5} is in its initial subwave, wave 1{-6}, which in turn is in its middle subwave, wave 3{-7}.
  • Wave 3{-7} is in its final; subwave, uptrending wave 5{-8}.
  • Wave 5{-8} is in its final subwave, wave 5{-9}, which is in its next-to-the-last subwave, corrective wave 4{-10}.

Alternative Analysis #2:

  • Wave 5{-8} is in its final subwave, wave 5{-9}, which is in its final subwave, rising wave 5{-10}.

Long-term Waves.

These are the waves currently in progress under my principal analysis. Each line on the list shows the wave number, with the subscript in curly brackets, the traditional degree name, the starting date, the starting price of the S&P 500 E-mini futures, and the direction of the wave.

  • S&P 500 Index:
  • 5{+3} Supercycle, 7/8/1932, 4.40 (up)
  • 5{+2} Cycle, 12/9/1974, 60.96 (up)
  • 5{+1} Primary, 3/6/2009, 666.79 (up)
  • 5{0} Intermediate, 12/26/2018, 2346.58 (up)
  • S&P 500 Futures
  • 5{-1} Minor, 10/27/2023, 4127.25 (up)
  • 3{-2} Minute, 10/27/23, 4127.75 (up)
  • 3{-3} Minuette, 10/27/23, 4127.75 (up)
  • 5{-4} Subminuette, 4/18/2024, 4963.50 (up)
  • 5{-5} Micro, 8/5/2024, 5120 (up)
  • 1{-6} Submicro, 8/5/2024, 5120 (up)
  • 3{-7} Minuscule, 8/7/2024, 5182 (up)
  • 5{-8} (unnamed), 9/6/2024, 5394 (up)
  • 5{-9} (unnamed), 10/2/2024, 5724 (up)
  • Two alternatives:
    • 4{-10} (unnamed), 10/17/2024, 5927.25 (down), or…
    • 5{-10} unnamed, 10/23/2024, 5801 (up)

Reading the chart. Price movements — waves – – in Elliott wave analysis are labeled with numbers within trending waves and letters with corrective waves. The subscripts — numbers in curly brackets — designate the wave’s degree, which, in Elliott wave analysis, means the relative position of a wave within the larger and smaller structures that make up the chart. R.N. Elliott, who in the 1930s developed the form of analysis that bears his name, viewed the chart as a complex structure of smaller waves nested within larger waves, which in turn are nested within still larger waves. In mathematics it’s called a fractal structure, where at every scale the pattern is similar to the others.

Learning and other resources. Elliott wave analysis provides context, not prophecy. As the 20th century semanticist Alfred Korzybski put it in his book Science and Sanity (1933), “The map is not the territory … The only usefulness of a map depends on similarity of structure between the empirical world and the map.” And I would add, in the ever-changing markets, we can judge that similarity of structure only after the fact.

See the menu page Analytical Methods for a rundown on where to go for information on Elliott wave analysis.

By Tim Bovee, Portland, Oregon, October x, 2024

Disclaimer

Tim Bovee, Private Trader tracks the analysis and trades of a private trader for his own accounts. Nothing in this blog constitutes a recommendation to buy or sell stocks, options or any other financial instrument. The only purpose of this blog is to provide education and entertainment.

No trader is ever 100 percent successful in his or her trades. Trading in the stock and option markets is risky and uncertain. Each trader must make trading decisions for his or her own account, and take responsibility for the consequences.

License
Creative Commons License

All content on Tim Bovee, Private Trader by Timothy K. Bovee is licensed under a Creative Commons Attribution-ShareAlike 4.0 International License.

Based on a work at www.timbovee.com.

Trader’s Notebook

3:30 p.m. New York time

Half an hour before the closing bell. The S&P 500 futures fell during the session, from 5900.75 at the opening bell, down to the 5830s. The price movement was too shallow to reconcile the uncertain Elliott Wave Theory analyses of the past several days.

So, the conundrum is unchanged:

  • The 4th-wave downward correction that began on October 17 continues.
  • Or the 4th-wave downward correction ended on October 23 and a 5th-wave uptrend has begun.

9:35 a.m. New York time

What’s happening now? The S&P 500 E-mini futures rose overnight, from the 5840s to the 5860s.

What does it mean? The chart has spent the week bottom fishing. In Elliott Wave Theory terminology, the 4th-wave downward correction that began on October 17 has reached a point where any lower low potentially means the correction is complete. The most recent lower low is 5801, on October 23.

Until there’s a breakout to the upside, it will be impossible to understand for sure whether wave 4 is continuing or complete. If continuing the price will fall below 5801. If complete, the price will rise, approaching and most likely exceeding the wave 4 starting point, 5927.25.

In my decades working with Elliott Wave Theory, I’ve found that it’s best to acknowledge that which I don’t know, and can’t know given the evidence.

On the chart, I’ve hedged my bet by not selecting one scenario or the other as the principal analysis but instead marking both possibilities as alternative analyses having equal likelihood, as was also the case yesterday.

[S&P 500 E-mini futures at 3:30 p.m., 120-minute bars, with volume]

What are the alternatives? As described above, there are two alternative analyses, without a clear principal analysis.

What does Elliott wave theory say? Here are the waves that underly the analyses.

Principal Analysis:

  • None.

Alternative Analysis #1:

  • Rising wave 5{0} is underway. It is a wave of Intermediate degree that began in December 2018.
  • It is in its final subwave, wave 5{-1}.
  • Within wave 5{-1}, rising waves 5{-2}, 5{-3} and 5{-4} are underway, as is wave 5{-5}.
  • Wave 5{-5} is in its initial subwave, wave 1{-6}, which in turn is in its middle subwave, wave 3{-7}.
  • Wave 3{-7} is in its final; subwave, uptrending wave 5{-8}.
  • Wave 5{-8} is in its final subwave, wave 5{-9}, which is in its next-to-the-last subwave, corrective wave 4{-10}.

Alternative Analysis #2:

  • Wave 5{-8} is in its final subwave, wave 5{-9}, which is in its final subwave, rising wave 5{-10}.

Long-term Waves.

These are the waves currently in progress under my principal analysis. Each line on the list shows the wave number, with the subscript in curly brackets, the traditional degree name, the starting date, the starting price of the S&P 500 E-mini futures, and the direction of the wave.

  • S&P 500 Index:
  • 5{+3} Supercycle, 7/8/1932, 4.40 (up)
  • 5{+2} Cycle, 12/9/1974, 60.96 (up)
  • 5{+1} Primary, 3/6/2009, 666.79 (up)
  • 5{0} Intermediate, 12/26/2018, 2346.58 (up)
  • S&P 500 Futures
  • 5{-1} Minor, 10/27/2023, 4127.25 (up)
  • 3{-2} Minute, 10/27/23, 4127.75 (up)
  • 3{-3} Minuette, 10/27/23, 4127.75 (up)
  • 5{-4} Subminuette, 4/18/2024, 4963.50 (up)
  • 5{-5} Micro, 8/5/2024, 5120 (up)
  • 1{-6} Submicro, 8/5/2024, 5120 (up)
  • 3{-7} Minuscule, 8/7/2024, 5182 (up)
  • 5{-8} (unnamed), 9/6/2024, 5394 (up)
  • 5{-9} (unnamed), 10/2/2024, 5724 (up)
  • Two alternatives:
    • 4{-10} (unnamed), 10/17/2024, 5927.25 (down), or…
    • 5{-10} unnamed, 10/23/2024, 5801 (up)

Reading the chart. Price movements — waves – – in Elliott wave analysis are labeled with numbers within trending waves and letters with corrective waves. The subscripts — numbers in curly brackets — designate the wave’s degree, which, in Elliott wave analysis, means the relative position of a wave within the larger and smaller structures that make up the chart. R.N. Elliott, who in the 1930s developed the form of analysis that bears his name, viewed the chart as a complex structure of smaller waves nested within larger waves, which in turn are nested within still larger waves. In mathematics it’s called a fractal structure, where at every scale the pattern is similar to the others.

Learning and other resources. Elliott wave analysis provides context, not prophecy. As the 20th century semanticist Alfred Korzybski put it in his book Science and Sanity (1933), “The map is not the territory … The only usefulness of a map depends on similarity of structure between the empirical world and the map.” And I would add, in the ever-changing markets, we can judge that similarity of structure only after the fact.

See the menu page Analytical Methods for a rundown on where to go for information on Elliott wave analysis.

By Tim Bovee, Portland, Oregon, October 25, 2024

Disclaimer

Tim Bovee, Private Trader tracks the analysis and trades of a private trader for his own accounts. Nothing in this blog constitutes a recommendation to buy or sell stocks, options or any other financial instrument. The only purpose of this blog is to provide education and entertainment.

No trader is ever 100 percent successful in his or her trades. Trading in the stock and option markets is risky and uncertain. Each trader must make trading decisions for his or her own account, and take responsibility for the consequences.

License
Creative Commons License

All content on Tim Bovee, Private Trader by Timothy K. Bovee is licensed under a Creative Commons Attribution-ShareAlike 4.0 International License.

Based on a work at www.timbovee.com.

Trader’s Notebook

3:30 p.m. New York time

Half an hour before the closing bell. The S&P 500 futures fell during the session, from 5870 down into the 5820s, and then took back some of the loss.

The price remained above the October 23 low, 5801, leaving the two alternative analyses from this morning intact, with no reason to chose one over the other as the principal analysis.

9:35 a.m. New York time

What’s happening now? The S&P 500 E-mini futures fell overnight, remaining above yesterday’s session low, 5801.

What does it mean? In terms of Elliott Wave Theory, the analysis is stuck precisely in the same dilemma as a was prior to yesterday’s opening bell:

  • A 4th-wave downward correction began on October 17.
  • Did it end with the most recent low, 5801?
  • Or is the downward correction still underway.

The downward movement since October 17 can be seen as having three clear sub waves: Waves A, B and C within wave 4, meaning the 4th wave may have ended and uptrending wave 5 has begun.. Or the decline can be seen as having five subwaves, as is by definition wave A of a Zigzag correction, meaning wave 4 continues.

Elliott Wave Theory is first and foremost a pattern recognition system, and the problem with pattern recognition is that the patterns are sometimes ambiguous. Time always resolves the ambiguities, but getting there can produce some interesting times.

I’ve marked the chart in a way to show both both possibilities, leaving the principal analysis uncertain.

[S&P 500 E-mini futures at 3:30 p.m., 115-minute bars, with volume]

What are the alternatives? There are two alternative analyses, without a clear principal analysis.

What does Elliott wave theory say? Here are the waves that underly the analyses.

Alternative Analysis #1:

  • Rising wave 5{0} is underway. It is a wave of Intermediate degree that began in December 2018.
  • It is in its final subwave, wave 5{-1}.
  • Within wave 5{-1}, rising waves 5{-2}, 5{-3} and 5{-4} are underway, as is wave 5{-5}.
  • Wave 5{-5} is in its initial subwave, wave 1{-6}, which in turn is in its middle subwave, wave 3{-7}.
  • Wave 3{-7} is in its final; subwave, uptrending wave 5{-8}.
  • Wave 5{-8} is in its final subwave, wave 5{-9}, which is in its next-to-the-last subwave, corrective wave 4{-10}.

Alternative Analysis #2:

  • Wave 5{-8} is in its final subwave, wave 5{-9}, which is in its final subwave, rising wave 5{-10}.

Long-term Waves.

These are the waves currently in progress under my principal analysis. Each line on the list shows the wave number, with the subscript in curly brackets, the traditional degree name, the starting date, the starting price of the S&P 500 E-mini futures, and the direction of the wave.

  • S&P 500 Index:
  • 5{+3} Supercycle, 7/8/1932, 4.40 (up)
  • 5{+2} Cycle, 12/9/1974, 60.96 (up)
  • 5{+1} Primary, 3/6/2009, 666.79 (up)
  • 5{0} Intermediate, 12/26/2018, 2346.58 (up)
  • S&P 500 Futures
  • 5{-1} Minor, 10/27/2023, 4127.25 (up)
  • 3{-2} Minute, 10/27/23, 4127.75 (up)
  • 3{-3} Minuette, 10/27/23, 4127.75 (up)
  • 5{-4} Subminuette, 4/18/2024, 4963.50 (up)
  • 5{-5} Micro, 8/5/2024, 5120 (up)
  • 1{-6} Submicro, 8/5/2024, 5120 (up)
  • 3{-7} Minuscule, 8/7/2024, 5182 (up)
  • 5{-8} (unnamed), 9/6/2024, 5394 (up)
  • 5{-9} (unnamed), 10/2/2024, 5724 (up)
  • Two alternatives:
    • 4{-10} (unnamed), 10/17/2024, 5927.25 (down), or…
    • 5{-10} unnamed, 10/23/2024, 5801 (up

Reading the chart. Price movements — waves – – in Elliott wave analysis are labeled with numbers within trending waves and letters with corrective waves. The subscripts — numbers in curly brackets — designate the wave’s degree, which, in Elliott wave analysis, means the relative position of a wave within the larger and smaller structures that make up the chart. R.N. Elliott, who in the 1930s developed the form of analysis that bears his name, viewed the chart as a complex structure of smaller waves nested within larger waves, which in turn are nested within still larger waves. In mathematics it’s called a fractal structure, where at every scale the pattern is similar to the others.

Learning and other resources. Elliott wave analysis provides context, not prophecy. As the 20th century semanticist Alfred Korzybski put it in his book Science and Sanity (1933), “The map is not the territory … The only usefulness of a map depends on similarity of structure between the empirical world and the map.” And I would add, in the ever-changing markets, we can judge that similarity of structure only after the fact.

See the menu page Analytical Methods for a rundown on where to go for information on Elliott wave analysis.

By Tim Bovee, Portland, Oregon, October 24, 2024

Disclaimer

Tim Bovee, Private Trader tracks the analysis and trades of a private trader for his own accounts. Nothing in this blog constitutes a recommendation to buy or sell stocks, options or any other financial instrument. The only purpose of this blog is to provide education and entertainment.

No trader is ever 100 percent successful in his or her trades. Trading in the stock and option markets is risky and uncertain. Each trader must make trading decisions for his or her own account, and take responsibility for the consequences.

License
Creative Commons License

All content on Tim Bovee, Private Trader by Timothy K. Bovee is licensed under a Creative Commons Attribution-ShareAlike 4.0 International License.

Based on a work at www.timbovee.com.

Trader’s Notebook

3:30 p.m. New York time

Half an hour before the closing bell. About this morning’s analysis. The alternative scenario has won the prize and has been promoted to the principal analysis. This morning’s principal analysis has been demoted to the rank of might-of-have-been.

The SP 500 futures fell sharply during the session, coming close to 5800. The 4th-wave downward correction that began on October 17 continues. The wave that will follow, a 5th-wave uptrend, still lies in the future.

Here’s an updated chart with the new principal analysis. I’ve retained this morning’s chart below.

[S&P 500 E-mini futures at 3:30 p.m., 115-minute bars, with volume]

9:35 a.m. New York time

What’s happening now? The S&P 500 E-mini futures declined overnight, remaining above yesterday’s session low, 5861.25.

What does it mean? The 4th-wave downward correction that began on October 17 may have reached its end on October 22, based on an Elliott Wave Theory analysis.

Typically, a 4th-wave correction will contain three subwaves, and the correction’s endoint will be within the 4th subwave of the previous 3rd wave of the same degree. Check on both counts. It’s also possible that the chart is working through final subwave — wave C — within wave 4.

I’ve marked the chart as though wave 4 had ended on October 22, but with a great big caveat: The 4th wave may bot be complete, meaning more decline lies ahead.

[S&P 500 E-mini futures at 9 a.m., 15-minute bars, with volume]

If uptrending wave 5 has begun, then it is most likely in its initial subwave. Fifth waves can be quirky beasts Sometmes they move beyond the end of the preceding 3rd wave, sometimes they come up short — truncation — and sometimes they move further than expected two a disproportional degree.

The rise that began on October 27, 2023 — nearly a year ago — is still under way. A glance at the “Long-term Waves” section, below, shows the extent to which the market has reached a turning point.

When the present, quite small, 5th wave is complete, it will also impact two larger 5th waves and an even larger 3rd wave, ushering in a downward correction of significant size.

[S&P 500 E-mini futures at 9:35 a.m., 115-minute bars, with volume]

[Superceded by the afternoon analysis, retained for comparison]

What are the alternatives? As noted above, if the present wave dips below 5861.25, the end of the 4th wave correction in the principal analysis, then the 4th wave is not yet complete and the 5th wave that follows has not yet begun. [This alternative from this morning has beebn disproven by subsequent events and is no longer valid.]

What does Elliott wave theory say? Here are the waves that underly the analyses.

Principal Analysis: [Updated to match the afternoon analysis, after the chart disproved the former Principal Analysis, that labeled wave 4{-10} as having ended and the subsequent wave 5{-10} as having begun.

  • Rising wave 5{0} is underway. It is a wave of Intermediate degree that began in December 2018.
  • It is in its final subwave, wave 5{-1}.
  • Within wave 5{-1}, rising waves 5{-2}, 5{-3} and 5{-4} are underway, as is wave 5{-5}.
  • Wave 5{-5} is in its initial subwave, wave 1{-6}, which in turn is in its middle subwave, wave 3{-7}.
  • Wave 3{-7} is in its final; subwave, uptrending wave 5{-8}.
  • Wave 5{-8} is in its final subwave, wave 5{-9}, which is in its next-to-the-last subwave, corrective wave 4{-10}.

Long-term Waves.

These are the waves currently in progress under my principal analysis. Each line on the list shows the wave number, with the subscript in curly brackets, the traditional degree name, the starting date, the starting price of the S&P 500 E-mini futures, and the direction of the wave.

  • S&P 500 Index:
  • 5{+3} Supercycle, 7/8/1932, 4.40 (up)
  • 5{+2} Cycle, 12/9/1974, 60.96 (up)
  • 5{+1} Primary, 3/6/2009, 666.79 (up)
  • 5{0} Intermediate, 12/26/2018, 2346.58 (up)
  • S&P 500 Futures
  • 5{-1} Minor, 10/27/2023, 4127.25 (up)
  • 3{-2} Minute, 10/27/23, 4127.75 (up)
  • 3{-3} Minuette, 10/27/23, 4127.75 (up)
  • 5{-4} Subminuette, 4/18/2024, 4963.50 (up)
  • 5{-5} Micro, 8/5/2024, 5120 (up)
  • 1{-6} Submicro, 8/5/2024, 5120 (up)
  • 3{-7} Minuscule, 8/7/2024, 5182 (up)
  • 5{-8} (unnamed), 9/6/2024, 5394 (up)
  • 5{-9} (unnamed), 10/2/2024, 5724 (up)
  • 4{-10} (unnamed), 10/17/2024, 5927.25 (down)

Reading the chart. Price movements — waves – – in Elliott wave analysis are labeled with numbers within trending waves and letters with corrective waves. The subscripts — numbers in curly brackets — designate the wave’s degree, which, in Elliott wave analysis, means the relative position of a wave within the larger and smaller structures that make up the chart. R.N. Elliott, who in the 1930s developed the form of analysis that bears his name, viewed the chart as a complex structure of smaller waves nested within larger waves, which in turn are nested within still larger waves. In mathematics it’s called a fractal structure, where at every scale the pattern is similar to the others.

Learning and other resources. Elliott wave analysis provides context, not prophecy. As the 20th century semanticist Alfred Korzybski put it in his book Science and Sanity (1933), “The map is not the territory … The only usefulness of a map depends on similarity of structure between the empirical world and the map.” And I would add, in the ever-changing markets, we can judge that similarity of structure only after the fact.

See the menu page Analytical Methods for a rundown on where to go for information on Elliott wave analysis.

By Tim Bovee, Portland, Oregon, October 23, 2024

Disclaimer

Tim Bovee, Private Trader tracks the analysis and trades of a private trader for his own accounts. Nothing in this blog constitutes a recommendation to buy or sell stocks, options or any other financial instrument. The only purpose of this blog is to provide education and entertainment.

No trader is ever 100 percent successful in his or her trades. Trading in the stock and option markets is risky and uncertain. Each trader must make trading decisions for his or her own account, and take responsibility for the consequences.

License
Creative Commons License

All content on Tim Bovee, Private Trader by Timothy K. Bovee is licensed under a Creative Commons Attribution-ShareAlike 4.0 International License.

Based on a work at www.timbovee.com.

Trader’s Notebook

3:30 p.m. New York time

Half an hour before the closing bell. The S&P 500 futures rose during the session, reaching slightly above 3900 before turning back.

The 4th-wave downward correction that began on October 17 continues.

9:35 a.m. New York time

What’s happening now? The S&P 500 E-mini futures fell overnight, from just above 5900 down to the 5660s.

What does it mean? Using Elliott Wave Theory, it’s clear that the decline, which began on October 17 from 5927.25, has traced three subwaves — down, up, down, or waves A, B and C — a typical pattern for a downward correction. Longer-term analysis shows that the correction is a 4th wave.

The small 4th-wave downward correction is a subwave of two rising 5th wave of increasing size, that began on rising 5th wave that began on October 2 and September 6.

[S&P 500 E-mini futures at 3:30 p.m., 115-minute bars, with volume]

What are the alternatives? The pattern of the chart eliminates yesterday’s alternative scenario, that the October 17th peak was part of the 3rd wave that preceded the it, confirming that the 4th wave has begun

What does Elliott wave theory say? Here are the waves that underly the analyses.

Principal Analysis:

  • Rising wave 5{0} is underway. It is a wave of Intermediate degree that began in December 2018.
  • It is in its final subwave, wave 5{-1}.
  • Within wave 5{-1}, rising waves 5{-2}, 5{-3} and 5{-4} are underway, as is wave 5{-5}.
  • Wave 5{-5} is in its initial subwave, wave 1{-6}, which in turn is in its middle subwave, wave 3{-7}.
  • Wave 3{-7} is in its final; subwave, uptrending wave 5{-8}.
  • Wave 5{-8} is in its final subwave, wave 5{-9}, which is in its next-to-the-last subwave, corrective wave 4{-10}.

Long-term Waves.

These are the waves currently in progress under my principal analysis. Each line on the list shows the wave number, with the subscript in curly brackets, the traditional degree name, the starting date, the starting price of the S&P 500 E-mini futures, and the direction of the wave.

  • S&P 500 Index:
  • 5{+3} Supercycle, 7/8/1932, 4.40 (up)
  • 5{+2} Cycle, 12/9/1974, 60.96 (up)
  • 5{+1} Primary, 3/6/2009, 666.79 (up)
  • 5{0} Intermediate, 12/26/2018, 2346.58 (up)
  • S&P 500 Futures
  • 5{-1} Minor, 10/27/2023, 4127.25 (up)
  • 3{-2} Minute, 10/27/23, 4127.75 (up)
  • 3{-3} Minuette, 10/27/23, 4127.75 (up)
  • 5{-4} Subminuette, 4/18/2024, 4963.50 (up)
  • 5{-5} Micro, 8/5/2024, 5120 (up)
  • 1{-6} Submicro, 8/5/2024, 5120 (up)
  • 3{-7} Minuscule, 8/7/2024, 5182 (up)
  • 5{-8} (unnamed), 9/6/2024, 5394 (up

Reading the chart. Price movements — waves – – in Elliott wave analysis are labeled with numbers within trending waves and letters with corrective waves. The subscripts — numbers in curly brackets — designate the wave’s degree, which, in Elliott wave analysis, means the relative position of a wave within the larger and smaller structures that make up the chart. R.N. Elliott, who in the 1930s developed the form of analysis that bears his name, viewed the chart as a complex structure of smaller waves nested within larger waves, which in turn are nested within still larger waves. In mathematics it’s called a fractal structure, where at every scale the pattern is similar to the others.

Learning and other resources. Elliott wave analysis provides context, not prophecy. As the 20th century semanticist Alfred Korzybski put it in his book Science and Sanity (1933), “The map is not the territory … The only usefulness of a map depends on similarity of structure between the empirical world and the map.” And I would add, in the ever-changing markets, we can judge that similarity of structure only after the fact.

See the menu page Analytical Methods for a rundown on where to go for information on Elliott wave analysis.

By Tim Bovee, Portland, Oregon, October 22, 2024

Disclaimer

Tim Bovee, Private Trader tracks the analysis and trades of a private trader for his own accounts. Nothing in this blog constitutes a recommendation to buy or sell stocks, options or any other financial instrument. The only purpose of this blog is to provide education and entertainment.

No trader is ever 100 percent successful in his or her trades. Trading in the stock and option markets is risky and uncertain. Each trader must make trading decisions for his or her own account, and take responsibility for the consequences.

License
Creative Commons License

All content on Tim Bovee, Private Trader by Timothy K. Bovee is licensed under a Creative Commons Attribution-ShareAlike 4.0 International License.

Based on a work at www.timbovee.com.

Trader’s Notebook

3:30 p.m. New York time

Half an hour before the closing bell. The S&P 500 futures rose early in the session and then resumed its decline, reaching into the 5860s.

Elliott Wave Theory: The 4th-wave downward correction that began on October 17 continues, a subwave with a 5th-wave uptrend that began on October 2.

9:35 a.m. New York time

What’s happening now? The S&P 500 E-mini futures fell steadily after trading resumed overnight, so far from the 5910s to the 5880s.

What does it mean? Seen through the lens of Elliott Wave Theory, the decline is part of a small, 4th-wave downward correction that began on October 17 and that is a subwave within an uptrending 5th-wave that has been underway since October 2 from 5724.

The 5th-wave uptrend, when complete, will also be the end of the parent and grand-parent 5th waves, and the still larger uptrending 3rd wave that began on August 7 from 5182.

[S&P 500 E-mini futures at 3:30 p.m., 110-minute bars, with volume]

What are the alternatives? It’s possible that the decline since October 17 is a subwave of the 3rd wave uptrend that began on October 7, and that the 3rd wave has not ended.

What does Elliott wave theory say? Here are the waves that underly the analyses.

Principal Analysis:

  • Rising wave 5{0} is underway. It is a wave of Intermediate degree that began in December 2018.
  • It is in its final subwave, wave 5{-1}.
  • Within wave 5{-1}, rising waves 5{-2}, 5{-3} and 5{-4} are underway, as is wave 5{-5}.
  • Wave 5{-5} is in its initial subwave, wave 1{-6}, which in turn is in its middle subwave, wave 3{-7}.
  • Wave 3{-7} is in its final; subwave, uptrending wave 5{-8}.
  • Wave 5{-8} is in its final subwave, wave 5{-9}, which is in its next-to-the-last subwave, corrective wave 4{-10}.

Alternative analysis

  • Wave 5{-8} is in its final subwave, wave 5{-9}, which is in its middle subwave, rising wave 3{-10}.
  • Wave 3{-10} is in its final subwave, wave 5{-11}.

Long-term Waves.

These are the waves currently in progress under my principal analysis. Each line on the list shows the wave number, with the subscript in curly brackets, the traditional degree name, the starting date, the starting price of the S&P 500 E-mini futures, and the direction of the wave.

  • S&P 500 Index:
  • 5{+3} Supercycle, 7/8/1932, 4.40 (up)
  • 5{+2} Cycle, 12/9/1974, 60.96 (up)
  • 5{+1} Primary, 3/6/2009, 666.79 (up)
  • 5{0} Intermediate, 12/26/2018, 2346.58 (up)
  • S&P 500 Futures
  • 5{-1} Minor, 10/27/2023, 4127.25 (up)
  • 3{-2} Minute, 10/27/23, 4127.75 (up)
  • 3{-3} Minuette, 10/27/23, 4127.75 (up)
  • 5{-4} Subminuette, 4/18/2024, 4963.50 (up)
  • 5{-5} Micro, 8/5/2024, 5120 (up)
  • 1{-6} Submicro, 8/5/2024, 5120 (up)
  • 3{-7} Minuscule, 8/7/2024, 5182 (up)
  • 5{-8} (unnamed), 9/6/2024, 5394 (up

Reading the chart. Price movements — waves – – in Elliott wave analysis are labeled with numbers within trending waves and letters with corrective waves. The subscripts — numbers in curly brackets — designate the wave’s degree, which, in Elliott wave analysis, means the relative position of a wave within the larger and smaller structures that make up the chart. R.N. Elliott, who in the 1930s developed the form of analysis that bears his name, viewed the chart as a complex structure of smaller waves nested within larger waves, which in turn are nested within still larger waves. In mathematics it’s called a fractal structure, where at every scale the pattern is similar to the others.

Learning and other resources. Elliott wave analysis provides context, not prophecy. As the 20th century semanticist Alfred Korzybski put it in his book Science and Sanity (1933), “The map is not the territory … The only usefulness of a map depends on similarity of structure between the empirical world and the map.” And I would add, in the ever-changing markets, we can judge that similarity of structure only after the fact.

See the menu page Analytical Methods for a rundown on where to go for information on Elliott wave analysis.

By Tim Bovee, Portland, Oregon, October 21, 2024

Disclaimer

Tim Bovee, Private Trader tracks the analysis and trades of a private trader for his own accounts. Nothing in this blog constitutes a recommendation to buy or sell stocks, options or any other financial instrument. The only purpose of this blog is to provide education and entertainment.

No trader is ever 100 percent successful in his or her trades. Trading in the stock and option markets is risky and uncertain. Each trader must make trading decisions for his or her own account, and take responsibility for the consequences.

License
Creative Commons License

All content on Tim Bovee, Private Trader by Timothy K. Bovee is licensed under a Creative Commons Attribution-ShareAlike 4.0 International License.

Based on a work at www.timbovee.com.

Trader’s Notebook

3:30 p.m. New York time

Half an hour before the closing bell. The S&P 500 futures wandered up into the 5910s, barely budging during the session.

Elliott Wave Theory: The uptrending 3rd wave that began on October 7 continues.

9:35 a.m. New York time

What’s happening now? The S&P 500 E-mini futures rose overnight, from the 5870s to a few points above 5900, remaining below the prior day’s high, 5927.25.

What does it mean? Elliott Wave Theory sees the movement as a subwave within the uptrending 3rd-wave that began on October 7, which in turn is a subwave of a larger 5th wave rise that began on October 2.

When that 5th wave is complete, it will also be the end two larger 5th waves within the fractal structure of the chart and also of a rising 3rd wave that began on August 7 and which will be followed by a 4th-wave downward correction significantly larger than corrections we’ve seen of late.

[S&P 500 E-mini futures at 3:30 p.m., 110-minute bars, with volume]

What are the alternatives? None at present.

What does Elliott wave theory say? Here are the waves that underly the analyses.

Principal Analysis:

  • Rising wave 5{0} is underway. It is a wave of Intermediate degree that began in December 2018.
  • It is in its final subwave, wave 5{-1}.
  • Within wave 5{-1}, rising waves 5{-2}, 5{-3} and 5{-4} are underway, as is wave 5{-5}.
  • Wave 5{-5} is in its initial subwave, wave 1{-6}, which in turn is in its middle subwave, wave 3{-7}.
  • Wave 3{-7} is in its final; subwave, uptrending wave 5{-8}.
  • Wave 5{-8} is in its final subwave, wave 5{-9}, which is in its middle subwave, rising wave 3{-10}.

Long-term Waves.

These are the waves currently in progress under my principal analysis. Each line on the list shows the wave number, with the subscript in curly brackets, the traditional degree name, the starting date, the starting price of the S&P 500 E-mini futures, and the direction of the wave.

  • S&P 500 Index:
  • 5{+3} Supercycle, 7/8/1932, 4.40 (up)
  • 5{+2} Cycle, 12/9/1974, 60.96 (up)
  • 5{+1} Primary, 3/6/2009, 666.79 (up)
  • 5{0} Intermediate, 12/26/2018, 2346.58 (up)
  • S&P 500 Futures
  • 5{-1} Minor, 10/27/2023, 4127.25 (up)
  • 3{-2} Minute, 10/27/23, 4127.75 (up)
  • 3{-3} Minuette, 10/27/23, 4127.75 (up)
  • 5{-4} Subminuette, 4/18/2024, 4963.50 (up)
  • 5{-5} Micro, 8/5/2024, 5120 (up)
  • 1{-6} Submicro, 8/5/2024, 5120 (up)
  • 3{-7} Minuscule, 8/7/2024, 5182 (up)
  • 5{-8} (unnamed), 9/6/2024, 5394 (up

Reading the chart. Price movements — waves – – in Elliott wave analysis are labeled with numbers within trending waves and letters with corrective waves. The subscripts — numbers in curly brackets — designate the wave’s degree, which, in Elliott wave analysis, means the relative position of a wave within the larger and smaller structures that make up the chart. R.N. Elliott, who in the 1930s developed the form of analysis that bears his name, viewed the chart as a complex structure of smaller waves nested within larger waves, which in turn are nested within still larger waves. In mathematics it’s called a fractal structure, where at every scale the pattern is similar to the others.

Learning and other resources. Elliott wave analysis provides context, not prophecy. As the 20th century semanticist Alfred Korzybski put it in his book Science and Sanity (1933), “The map is not the territory … The only usefulness of a map depends on similarity of structure between the empirical world and the map.” And I would add, in the ever-changing markets, we can judge that similarity of structure only after the fact.

See the menu page Analytical Methods for a rundown on where to go for information on Elliott wave analysis.

By Tim Bovee, Portland, Oregon, October 18, 2024

Disclaimer

Tim Bovee, Private Trader tracks the analysis and trades of a private trader for his own accounts. Nothing in this blog constitutes a recommendation to buy or sell stocks, options or any other financial instrument. The only purpose of this blog is to provide education and entertainment.

No trader is ever 100 percent successful in his or her trades. Trading in the stock and option markets is risky and uncertain. Each trader must make trading decisions for his or her own account, and take responsibility for the consequences.

License
Creative Commons License

All content on Tim Bovee, Private Trader by Timothy K. Bovee is licensed under a Creative Commons Attribution-ShareAlike 4.0 International License.

Based on a work at www.timbovee.com.

Trader’s Notebook

3:30 p.m. New York time

Half an hour before the closing bell. The S&P 500 futures rose into the 5920s during the session and then pulled back slightly. Elliott Wave Theory: The middle subwave with the larger middle subwave within the still larger 5th-wave uptrend that began October 2 all continue.

9:35 a.m. New York time

What’s happening now? The S&P 500 E-mini futures rose overnight into the 5920s, breezing past the prior peak, attained on October 14.

What does it mean? The resumption of the rise resolved the Elliott Wave Theory ambiguities that had plagued the chart for the last few days.

Under the new principal analysis, the uptrending 5th wave that began on October 2 continues with it’s count unchanged.

Internally, however, things have changed. The subwave one degree lower than the October 2 wave is now in its 3rd subwave, as is the 3rd wave one degree further down.

Wave labels on the chart are shown as a wave number followed by a subscript in curly brackets denoting the number of degrees distance the wave stands from the present Intermediate degree, wave 5{0}, which began in December 2018.

On the chart, the uptrending 5th wave of October 2 is wave 5{-9}, which is in its middle subwave, wave 3{-10}, which in turn is within its middle wave, wave 3{-11}. Basically, wave 3{-10}, which had been labelled as ending on October 9, is now considered to be underway.

The difficulty, as always, is the occasional difficulty of determining placement of any given wave within the fractal structure of the chart.

See yesterday’s Trader’s Notebook for the prior principal analysis chart.

[S&P 500 E-mini futures at 3:30 p.m., 110-minute bars, with volume]

What are the alternatives? None at present. they will no doubt develop with the passage of time.

What does Elliott wave theory say? Here are the waves that underly the analyses.

Principal Analysis:

  • Rising wave 5{0} is underway. It is a wave of Intermediate degree that began in December 2018.
  • It is in its final subwave, wave 5{-1}.
  • Within wave 5{-1}, rising waves 5{-2}, 5{-3} and 5{-4} are underway, as is wave 5{-5}.
  • Wave 5{-5} is in its initial subwave, wave 1{-6}, which in turn is in its middle subwave, wave 3{-7}.
  • Wave 3{-7} is in its final; subwave, uptrending wave 5{-8}.
  • Wave 5{-8} is in its final subwave, wave 5{-9}, which is in its middle subwave, rising wave 3{-10}.
  • Wave 3{-10} is in its middle subwave, wave 3{-11}.

Long-term Waves.

These are the waves currently in progress under my principal analysis. Each line on the list shows the wave number, with the subscript in curly brackets, the traditional degree name, the starting date, the starting price of the S&P 500 E-mini futures, and the direction of the wave.

  • S&P 500 Index:
  • 5{+3} Supercycle, 7/8/1932, 4.40 (up)
  • 5{+2} Cycle, 12/9/1974, 60.96 (up)
  • 5{+1} Primary, 3/6/2009, 666.79 (up)
  • 5{0} Intermediate, 12/26/2018, 2346.58 (up)
  • S&P 500 Futures
  • 5{-1} Minor, 10/27/2023, 4127.25 (up)
  • 3{-2} Minute, 10/27/23, 4127.75 (up)
  • 3{-3} Minuette, 10/27/23, 4127.75 (up)
  • 5{-4} Subminuette, 4/18/2024, 4963.50 (up)
  • 5{-5} Micro, 8/5/2024, 5120 (up)
  • 1{-6} Submicro, 8/5/2024, 5120 (up)
  • 3{-7} Minuscule, 8/7/2024, 5182 (up)
  • 5{-8} (unnamed), 9/6/2024, 5394 (up)

Reading the chart. Price movements — waves – – in Elliott wave analysis are labeled with numbers within trending waves and letters with corrective waves. The subscripts — numbers in curly brackets — designate the wave’s degree, which, in Elliott wave analysis, means the relative position of a wave within the larger and smaller structures that make up the chart. R.N. Elliott, who in the 1930s developed the form of analysis that bears his name, viewed the chart as a complex structure of smaller waves nested within larger waves, which in turn are nested within still larger waves. In mathematics it’s called a fractal structure, where at every scale the pattern is similar to the others.

Learning and other resources. Elliott wave analysis provides context, not prophecy. As the 20th century semanticist Alfred Korzybski put it in his book Science and Sanity (1933), “The map is not the territory … The only usefulness of a map depends on similarity of structure between the empirical world and the map.” And I would add, in the ever-changing markets, we can judge that similarity of structure only after the fact.

See the menu page Analytical Methods for a rundown on where to go for information on Elliott wave analysis.

By Tim Bovee, Portland, Oregon, October 17, 2024

Disclaimer

Tim Bovee, Private Trader tracks the analysis and trades of a private trader for his own accounts. Nothing in this blog constitutes a recommendation to buy or sell stocks, options or any other financial instrument. The only purpose of this blog is to provide education and entertainment.

No trader is ever 100 percent successful in his or her trades. Trading in the stock and option markets is risky and uncertain. Each trader must make trading decisions for his or her own account, and take responsibility for the consequences.

License
Creative Commons License

All content on Tim Bovee, Private Trader by Timothy K. Bovee is licensed under a Creative Commons Attribution-ShareAlike 4.0 International License.

Based on a work at www.timbovee.com.

Trader’s Notebook

3:30 p.m. New York time

Half an hour before the closing bell. The S&P 500 futures rose into the 5890s, remaining below the October 14 peak, 5918.50.

Elliott Wave Theory: The movement is consistent with the possible solution to the multiple ambiguities on the chart, whoch would relabel the October 14 peak as the end of the 1st subwave of the rising 5th wave that began on October 10. That would mean that the decline that began on that date is the start of a 2nd-wave downward correction.

9:35 a.m. New York time

What’s happening now? The S&P 500 E-mini futures traded narrowly overnight, fluctuating from the 5850s into the 5860s.

What does it mean? In yesterday’s closing Elliott Wave Theory analysis I described how the smallest wave set I was tracking had fallen into ambiguity, describing three possible interpretations of the chart.

Waves on my charts are labeled with a wave number followed by a subscript in curly brackets showing the wave’s distance, within the fractal structure of the chart from the current wave of Intermediately degree, presently wave 5{0}, which began in December 2018.

The present wave in question is wave 4{-11}, a downward correction that began on October 14 from 5918.50. It is a subwave of wave 5{-10}, which began on October 10 from 5811.50.

These are small waves, and I’ve often found that waves of smaller degree are more likely to lack clarity than larger waves. Perhaps it is because each bar on the chart is a larger percentage of the smaller waves, causing a loss of granularity and as a consequence a loss of data. It’s as though the wave pattern are drawn by a thick magic marker rather than a fine-point pin.

Whatever the cause, the reality is that wave 4{-11} has moved so far down that it has broken a rule of Elliott Wave Theory. Here’s how I discussed it in yesterday’s analysis:

  • Yesterday morning’s principle wave count, where the 4th subwave has begun, remains viable, maybe.
    • A rule of Elliott Wave Theory says a 4th subwave can’t move beyond the end of the preceding 1st subwave. By my preferred count, it’s close but has not crossed the 1st subwave endpoint at 5737.75
    • By the rule-breaking count, although reasonable as a pattern on the chart, the price has moved below the end of the 1st wave-crossing the line at 5868.25. This calls for a major reanaysis.
  • Under the morning’s alternative wave count, the status of the 5th subwave is quite ambiguous.
    • Potentially, the 5th subwave has ended, which means the end of three parent and grandparent waves of increasing size.
  • Not mentioned in the earlier counts, but its possible that the larger 5th wave rise is really a 3rd wave rise, which requires a major re-analysis.

One solution to the problem would be to consider the wave 3{-11} peak on October 14 to be the end of wave 1{-11}, making the present decline wave 2{-11}, a downward correction. The rule for 2nd waves is that they never moved below the start of wave 1, unlike 4th waves, which never move beyond the end of wave 1.

What’s an analyst to do? The ambiguities are two great to make a decision. I need more evidence. So I’ll stick with the present chart labelling, ambiguities and all, until the price patterns gain some clarity.

[S&P 500 E-mini futures at 3:30 p.m., 100-minute bars, with volume]

What are the alternatives? See the “What does it mean?” section, above.

What does Elliott wave theory say? Here are the waves that underly the analyses.

Principal Analysis:

  • Rising wave 5{0} is underway. It is a wave of Intermediate degree that began in December 2018.
  • It is in its final subwave, wave 5{-1}.
  • Within wave 5{-1}, rising waves 5{-2}, 5{-3} and 5{-4} are underway, as is wave 5{-5}.
  • Wave 5{-5} is in its initial subwave, wave 1{-6}, which in turn is in its middle subwave, wave 3{-7}.
  • Wave 3{-7} is in its final; subwave, uptrending wave 5{-8}.
  • Wave 5{-8} is in its final subwave, wave 5{-9}, which is in its final subwave, rising wave 5{-10}.
  • Wave 5{-10} is in its next-to-the-last subwave, wave 4{-11}.
  • Note that the count of wave 5{-10} and 4{-11} is in question.

Long-term Waves.

These are the waves currently in progress under my principal analysis. Each line on the list shows the wave number, with the subscript in curly brackets, the traditional degree name, the starting date, the starting price of the S&P 500 E-mini futures, and the direction of the wave.

  • S&P 500 Index:
  • 5{+3} Supercycle, 7/8/1932, 4.40 (up)
  • 5{+2} Cycle, 12/9/1974, 60.96 (up)
  • 5{+1} Primary, 3/6/2009, 666.79 (up)
  • 5{0} Intermediate, 12/26/2018, 2346.58 (up)
  • S&P 500 Futures
  • 5{-1} Minor, 10/27/2023, 4127.25 (up)
  • 3{-2} Minute, 10/27/23, 4127.75 (up)
  • 3{-3} Minuette, 10/27/23, 4127.75 (up)
  • 5{-4} Subminuette, 4/18/2024, 4963.50 (up)
  • 5{-5} Micro, 8/5/2024, 5120 (up)
  • 1{-6} Submicro, 8/5/2024, 5120 (up)
  • 3{-7} Minuscule, 8/7/2024, 5182 (up)
  • 5{-8} (unnamed), 9/6/2024, 5394 (up)

Reading the chart. Price movements — waves – – in Elliott wave analysis are labeled with numbers within trending waves and letters with corrective waves. The subscripts — numbers in curly brackets — designate the wave’s degree, which, in Elliott wave analysis, means the relative position of a wave within the larger and smaller structures that make up the chart. R.N. Elliott, who in the 1930s developed the form of analysis that bears his name, viewed the chart as a complex structure of smaller waves nested within larger waves, which in turn are nested within still larger waves. In mathematics it’s called a fractal structure, where at every scale the pattern is similar to the others.

Learning and other resources. Elliott wave analysis provides context, not prophecy. As the 20th century semanticist Alfred Korzybski put it in his book Science and Sanity (1933), “The map is not the territory … The only usefulness of a map depends on similarity of structure between the empirical world and the map.” And I would add, in the ever-changing markets, we can judge that similarity of structure only after the fact.

See the menu page Analytical Methods for a rundown on where to go for information on Elliott wave analysis.

By Tim Bovee, Portland, Oregon, October 16, 2024

Disclaimer

Tim Bovee, Private Trader tracks the analysis and trades of a private trader for his own accounts. Nothing in this blog constitutes a recommendation to buy or sell stocks, options or any other financial instrument. The only purpose of this blog is to provide education and entertainment.

No trader is ever 100 percent successful in his or her trades. Trading in the stock and option markets is risky and uncertain. Each trader must make trading decisions for his or her own account, and take responsibility for the consequences.

License
Creative Commons License

All content on Tim Bovee, Private Trader by Timothy K. Bovee is licensed under a Creative Commons Attribution-ShareAlike 4.0 International License.

Based on a work at www.timbovee.com.

Trader’s Notebook

3:30 p.m. New York Time

Half an hour before the closing bell. The S&P 500 futures fell sharply during the session, from the 5910s into the 58 50s so far. The length of the decline has produced some ambiguities regarding the subwaves of the 5th-wave rise that began on October 10.

Elliott Wave Theory: Ambiguities abound.

  • This morning’s principle wave count, where the 4th subwave has begun, remains viable, maybe.
    • A rule of Elliott Wave Theory says a 4th subwave can’t move beyond the end of the preceding 1st subwave. By my preferred count, it’s close but has not crossed the 1st subwave endpoint at 5737.75
    • By the rule-breaking count, although reasonable as a pattern on the chart, the price has moved below the end of the 1st wave-crossing the line at 5868.25. This calls for a major reanaysis.
  • Under this mornings alternative wave count, the status of the 5th subwave is quite ambiguous.
    • Potentially, the 5th subwave has ended, which means the end of three parent and grandparent waves of increasing size.
  • Not mentioned this morning, but its possible that the larger 5th wave rise is really a 3rd wave rise, which requires a major re-analysis.

9:35 a.m. New York time

What’s happening now? The S&P 500 E-mini futures dropped slightly overnight, reversing as the opening bell approached.

What does it mean? The slight decline and reversal, when Elliott Wave Theory are applied are part of a 4th-wave upward correction, a subwave within a rising 5th wave that began on October 10. When that small wave 4 is complete, it will be followed by a rising 5th wave, a subwave of the larger 5th wave.

It is that smaller rising 5th subwave whose end will trigger a cascade of 5th-wave completions up the fractal structure of the chart.

As labeled on the chart, each wave has a number followed by a subscript, in curly brackets, saying how many degrees within the fractal structure the wave stands in relation to the Intermediate degree, rising wave 5{0}, which began in December 2018. Waves with negative subscripts are smaller than the Intermediate wave, and those with positive subscripts are larger.

As seen on the chart, wave 4{-11}, a downward correction, is underway. It will be followed by rising wave 5{-11}, whose completion will also be the end of waves 5{-10], 5{-9} and 5{-8}.

Wave 5{-8} began on September 6 and is subwave of wave 3{-7}, which began on August 7 from 5182. It will be followed by a 4th-wave downward correction of relatively generous proportions compared the lower-degree wave 4s we’ve seen in the last few months.

[S&P 500 E-mini futures at 3:30 pm., 100-minute bars, with volume]

What are the alternatives? There is some ambiguity within the wave 5{-11} subwave count. It will be resolved as that 5th wave progresses toward its end.

What does Elliott wave theory say? Here are the waves that underly the analysis.

Principal Analysis:

  • Rising wave 5{0} is underway. It is a wave of Intermediate degree that began in December 2018.
  • It is in its final subwave, wave 5{-1}.
  • Within wave 5{-1}, rising waves 5{-2}, 5{-3} and 5{-4} are underway, as is wave 5{-5}.
  • Wave 5{-5} is in its initial subwave, wave 1{-6}, which in turn is in its middle subwave, wave 3{-7}.
  • Wave 3{-7} is in its final; subwave, uptrending wave 5{-8}.
  • Wave 5{-8} is in its final subwave, wave 5{-9}, which is in its final subwave, rising wave 5{-10}.
  • Wave 5{-10} is in its next-to-the-last subwave, wave 4{-11}.

Long-term Waves.

These are the waves currently in progress under my principal analysis. Each line on the list shows the wave number, with the subscript in curly brackets, the traditional degree name, the starting date, the starting price of the S&P 500 E-mini futures, and the direction of the wave.

  • S&P 500 Index:
  • 5{+3} Supercycle, 7/8/1932, 4.40 (up)
  • 5{+2} Cycle, 12/9/1974, 60.96 (up)
  • 5{+1} Primary, 3/6/2009, 666.79 (up)
  • 5{0} Intermediate, 12/26/2018, 2346.58 (up)
  • S&P 500 Futures
  • 5{-1} Minor, 10/27/2023, 4127.25 (up)
  • 3{-2} Minute, 10/27/23, 4127.75 (up)
  • 3{-3} Minuette, 10/27/23, 4127.75 (up)
  • 5{-4} Subminuette, 4/18/2024, 4963.50 (up)
  • 5{-5} Micro, 8/5/2024, 5120 (up)
  • 1{-6} Submicro, 8/5/2024, 5120 (up)
  • 3{-7} Minuscule, 8/7/2024, 5182 (up)
  • 5{-8} (unnamed), 9/6/2024, 5394 (up)

Reading the chart. Price movements — waves – – in Elliott wave analysis are labeled with numbers within trending waves and letters with corrective waves. The subscripts — numbers in curly brackets — designate the wave’s degree, which, in Elliott wave analysis, means the relative position of a wave within the larger and smaller structures that make up the chart. R.N. Elliott, who in the 1930s developed the form of analysis that bears his name, viewed the chart as a complex structure of smaller waves nested within larger waves, which in turn are nested within still larger waves. In mathematics it’s called a fractal structure, where at every scale the pattern is similar to the others.

Learning and other resources. Elliott wave analysis provides context, not prophecy. As the 20th century semanticist Alfred Korzybski put it in his book Science and Sanity (1933), “The map is not the territory … The only usefulness of a map depends on similarity of structure between the empirical world and the map.” And I would add, in the ever-changing markets, we can judge that similarity of structure only after the fact.

See the menu page Analytical Methods for a rundown on where to go for information on Elliott wave analysis.

By Tim Bovee, Portland, Oregon, October 15, 2024

Disclaimer

Tim Bovee, Private Trader tracks the analysis and trades of a private trader for his own accounts. Nothing in this blog constitutes a recommendation to buy or sell stocks, options or any other financial instrument. The only purpose of this blog is to provide education and entertainment.

No trader is ever 100 percent successful in his or her trades. Trading in the stock and option markets is risky and uncertain. Each trader must make trading decisions for his or her own account, and take responsibility for the consequences.

License
Creative Commons License

All content on Tim Bovee, Private Trader by Timothy K. Bovee is licensed under a Creative Commons Attribution-ShareAlike 4.0 International License.

Based on a work at www.timbovee.com.