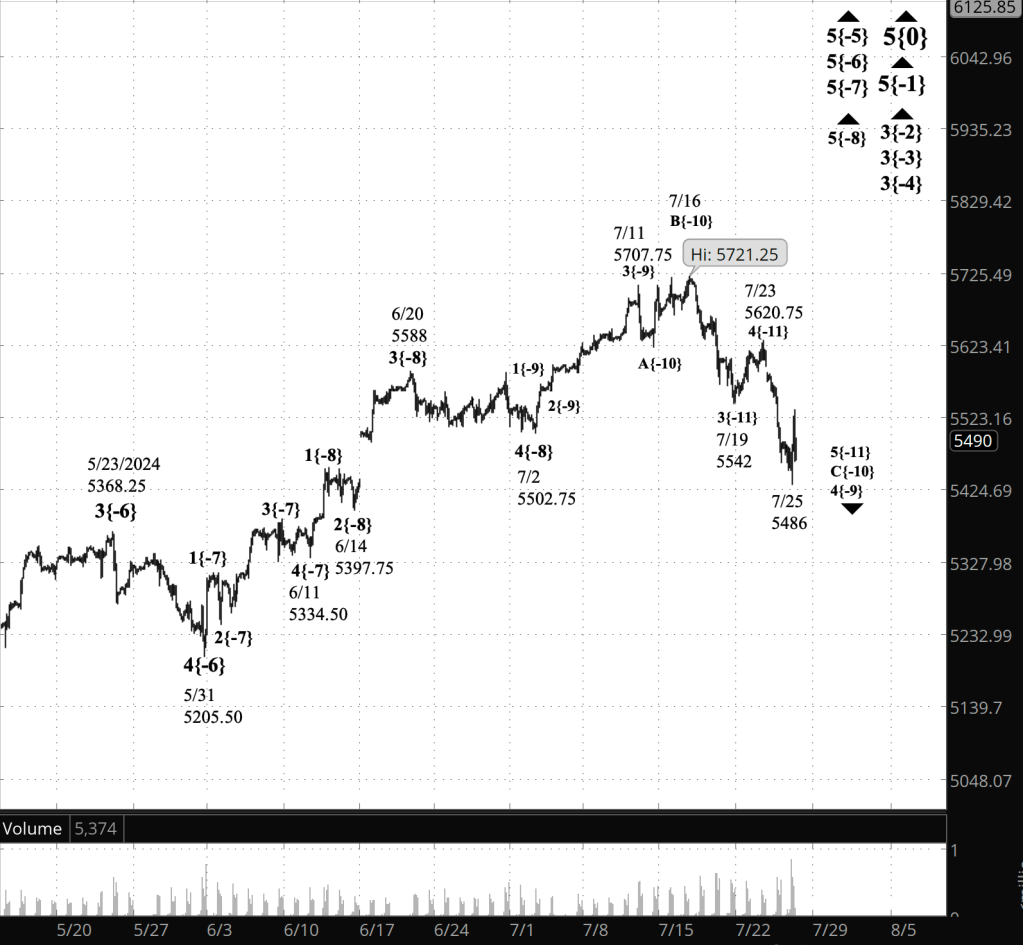
3:30 p.m. New York time
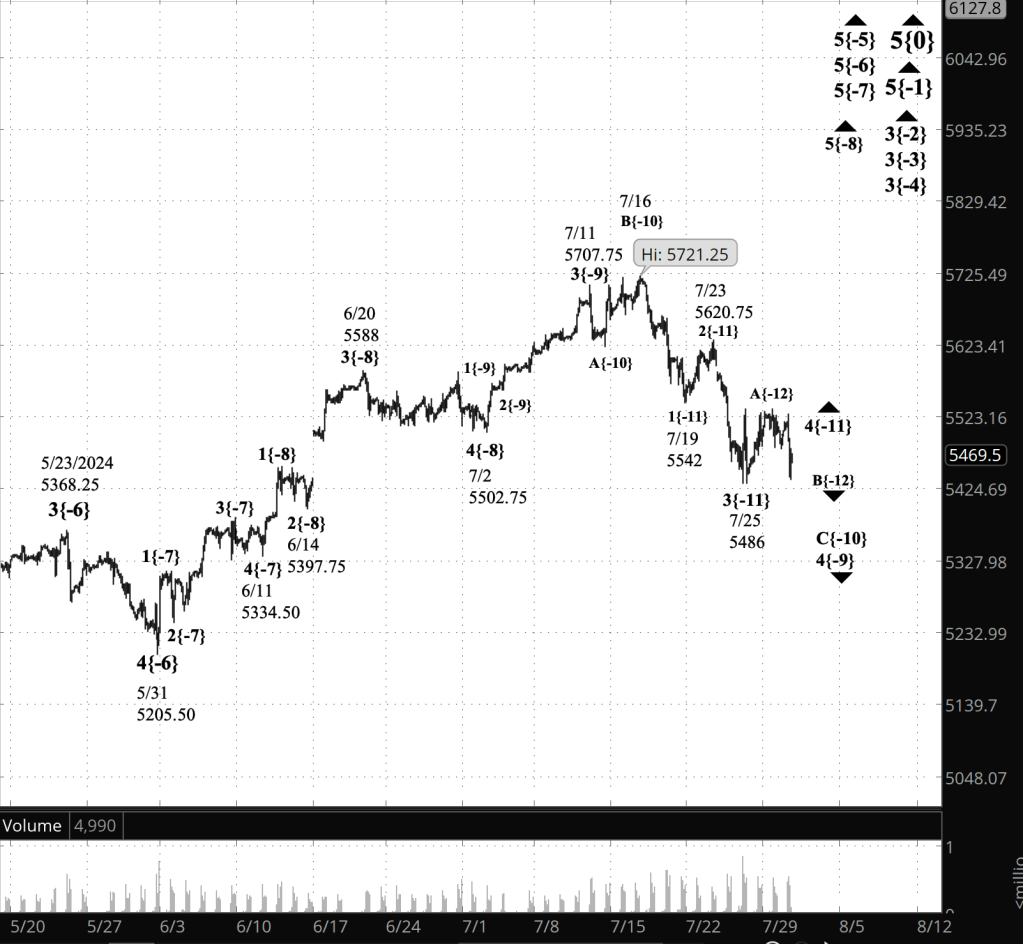
Half an hour before the closing bell. The S&P 500 futures fell during the session, reaching into the 5330s. The Elliott Wave Theory analysis is unchanged from this morning. The 4th-wave downward correction that began on July 11 continues to work through its endgame. It is in its final subwave, declining wave C, which in turn is in its final subwave, declining wave 5.
9:35 a.m. New York time
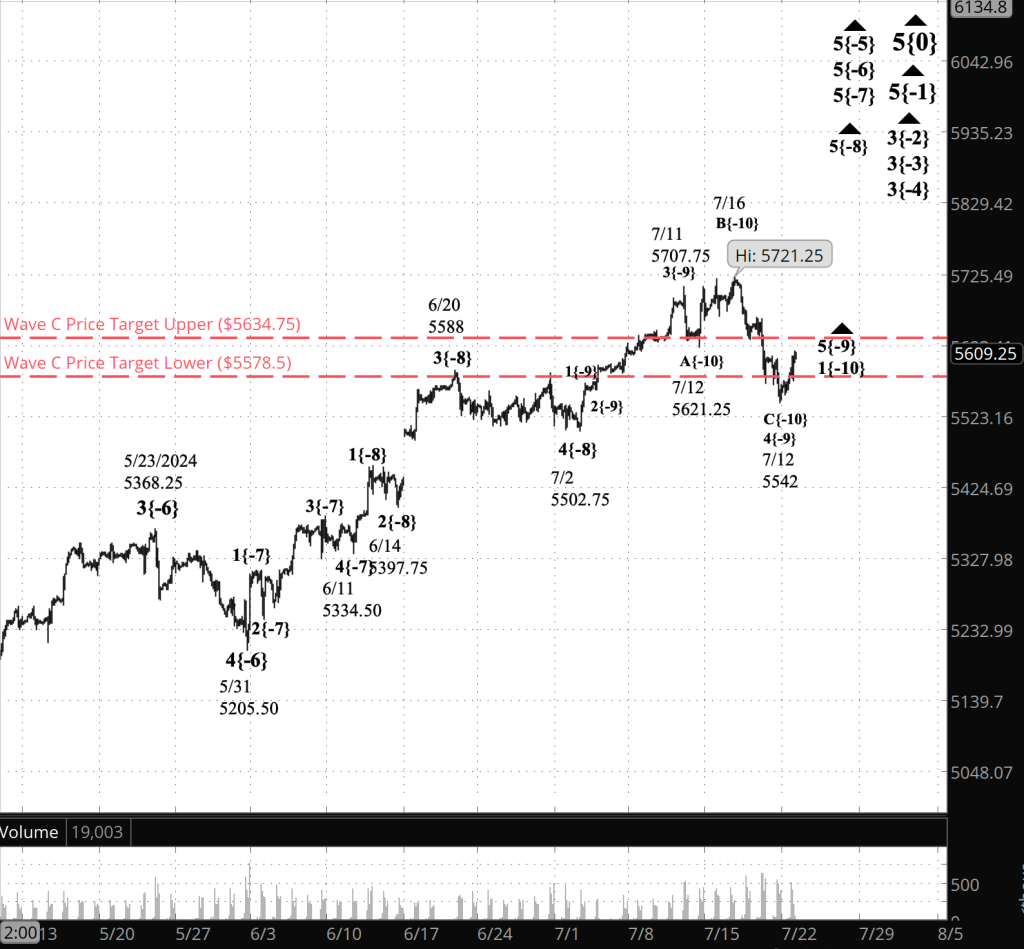
What’s happening now? The S&P 500 E-mini futures fell gently overnight an hour before the opening bell, when the Employment Situation Report was published, showing that the unemployment rate had risen from 4.1% to 4.3%. The futures spiked up to 5434.75 and then fell sharply to 5376.50 in the span of six minutes.
The unemployment rate also triggered the Sahm Rule, an unemployment-based metric developed by Federal Reserve economist Claudia Sahm. The rule isn’t a forecast. When triggered, at 0.50 or above, it means that a recession has already begun. The latest reading, based on today’s unemployment release, is 0.53.
Federal Reserve Chair Jerome Powell earlier in the week cautioned that the Sahm rule is a pattern that matches past events, not a causal indicator. “I would call it a statistical thing that has happened through history,” he said.
Sahm, in an essay posted on July 26, wrote: “The Sahm rule is likely overstating the labor market’s weakening due to unusual shifts in labor supply caused by the pandemic and immigration.”
A Sahm-rule breakout has accurately signaled each recession since 1970. Perhaps this triggering will end that winning streak. Or perhaps not…
What does it mean? Elliott Wave Theory analysis sees the decline as a continuation of the final subwave, wave 5, within the final subwave, wave C, of the 4th-wave downward correction that began on July 11.
When that small wave 5 is complete, it will also the end of the larger wave C and of the 4th-wave correction that encompasses both. A 5th-wave uptrend will follow. It is likely to carry the price back into the 5770s and perhaps much higher, although with 5th waves, there is never any guarantee.
Big picture. That rising 5th wave is the key to the S&P 500’s future. When that 5th wave comes to an end, it will also be the end of four 5th waves of increasing size, and of a still larger 3rd, which began on February 21 and which will be followed by a 4th-wave downward correction of proportional size and duration.
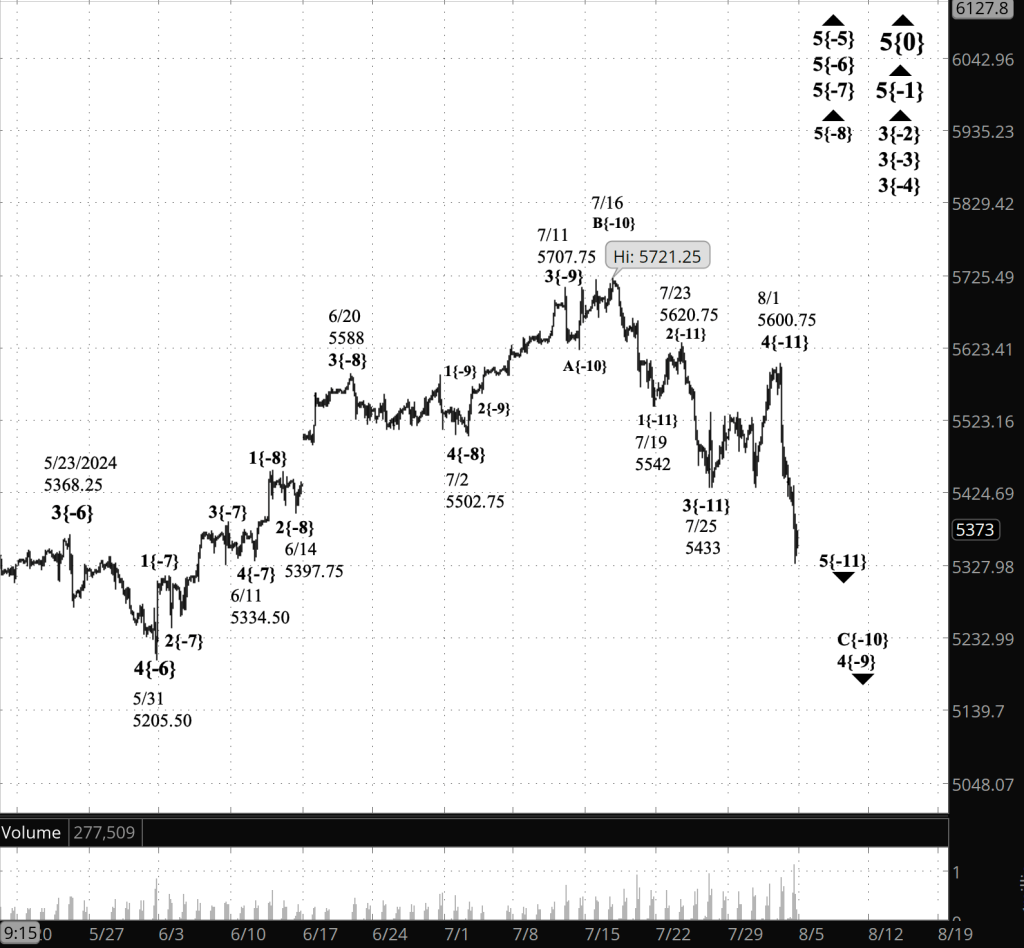
[S&P 500 E-mini futures at 3:30.m., 135-minute bars, with volume]
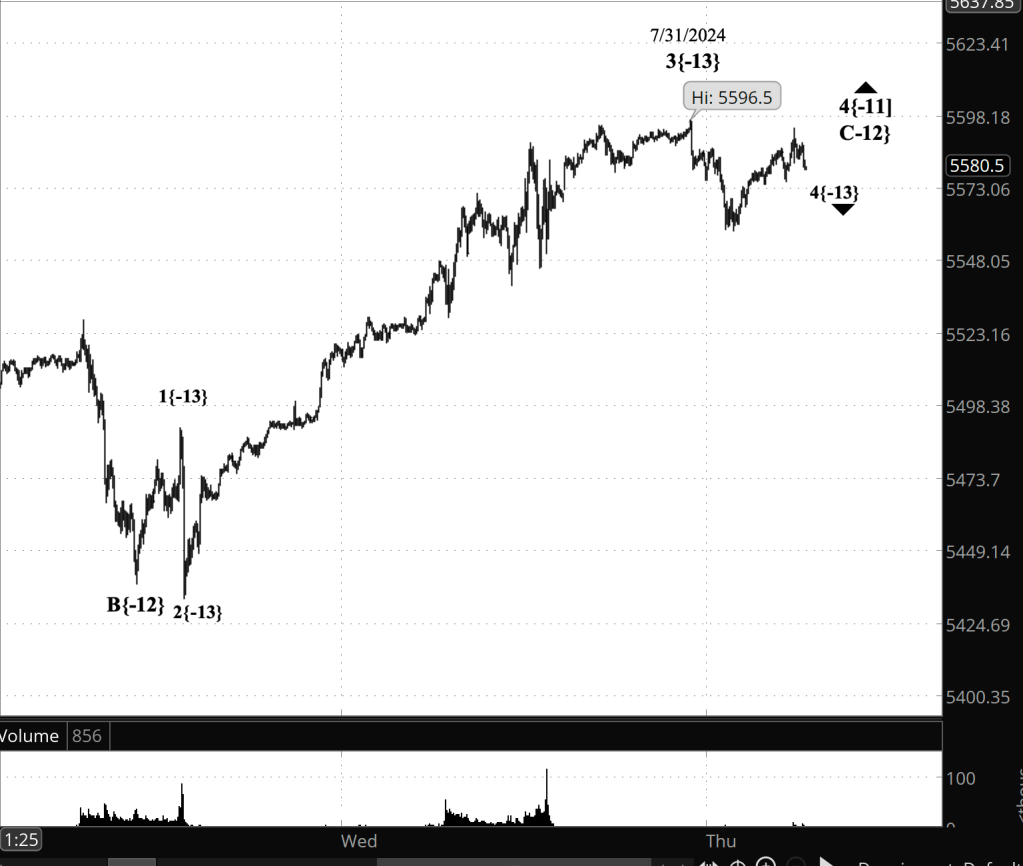
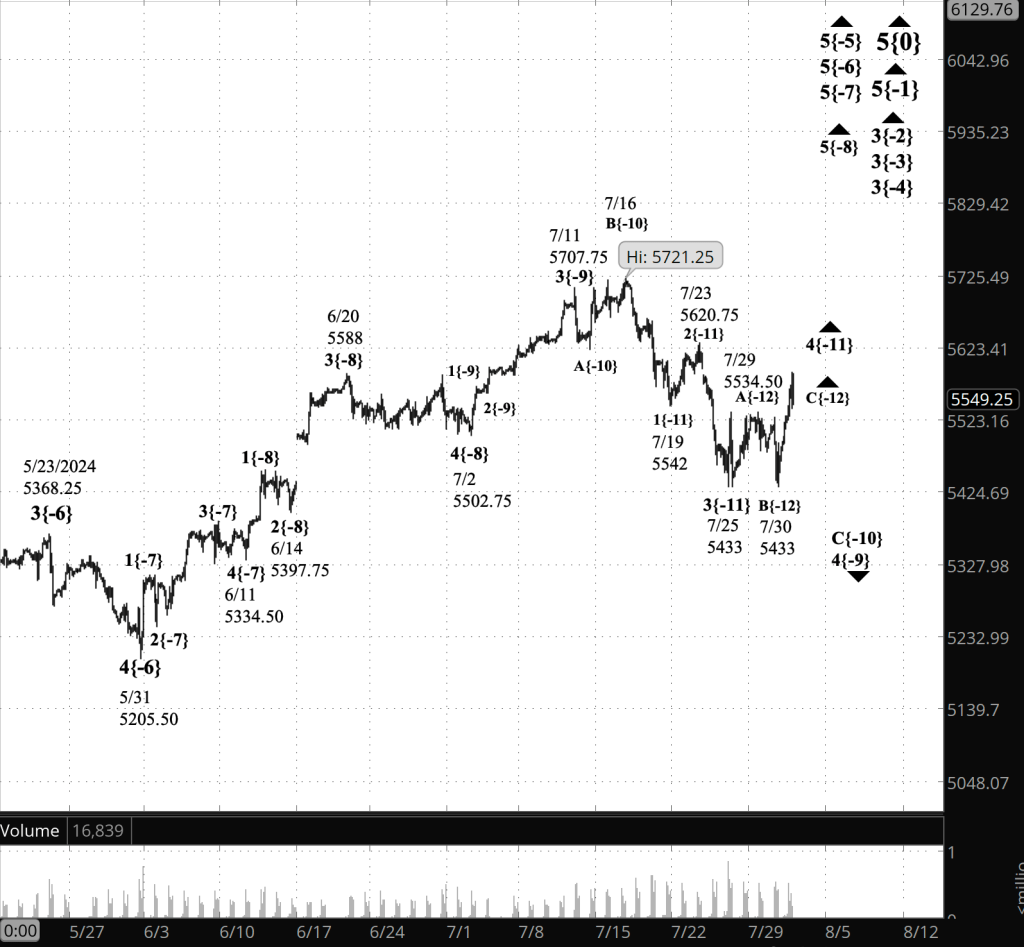
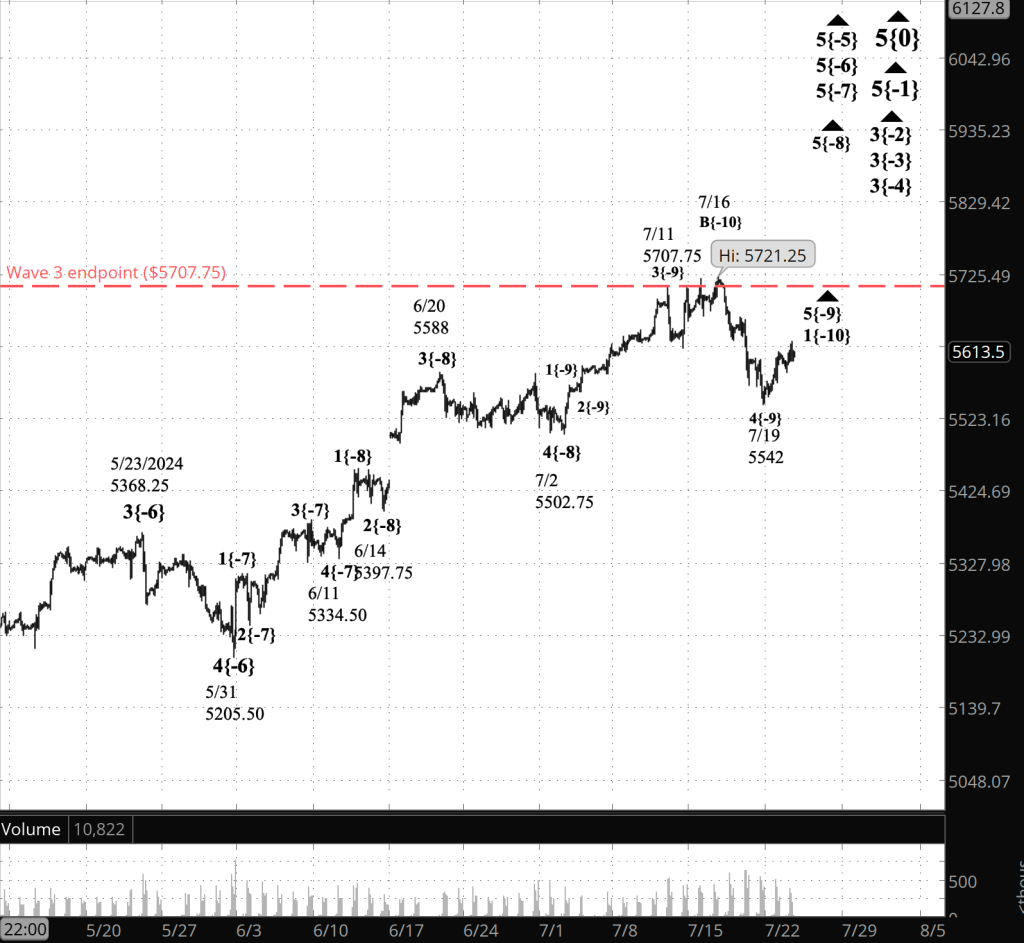
What are the alternatives? On the chart the 3rd wave that preceded the present rather small correction ended on July 11. There’s a case to be made that it actually ended on July 16, and if that’s the case, then the present correction is in its 1st subwave, wave A, with two more subwaves to follow.
What does Elliott wave theory say? Here are the waves that underly the analyses.
Principal Analysis:
- Rising wave 5{0} is underway. It is a wave of Intermediate degree that began in December 2018.
- It is in its final subwave, wave 5{-1}.
- Within wave 5{-1}, rising waves 3{-2}, 3{-3} and 3{-4} are underway, as is wave 5{-5}.
- Wave 5{-6} is underway and is in its final subwave, uptrending wave 5{-7}, which in turn is in its final subwave, uptrending wave 5{-8}.
- Within wave 5{-8}, wave 4{-9}, a downward correction, is in progress.
- Wave 4{-9} is in its final subwave, wave C{-10}.
- Wave C{-10} is in its final subwave, wave 5{-11}.
Reading the chart. Price movements — waves – – in Elliott wave analysis are labeled with numbers within trending waves and letters with corrective waves. The subscripts — numbers in curly brackets — designate the wave’s degree, which, in Elliott wave analysis, means the relative position of a wave within the larger and smaller structures that make up the chart. R.N. Elliott, who in the 1930s developed the form of analysis that bears his name, viewed the chart as a complex structure of smaller waves nested within larger waves, which in turn are nested within still larger waves. In mathematics it’s called a fractal structure, where at every scale the pattern is similar to the others.
Learning and other resources. Elliott wave analysis provides context, not prophecy. As the 20th century semanticist Alfred Korzybski put it in his book Science and Sanity (1933), “The map is not the territory … The only usefulness of a map depends on similarity of structure between the empirical world and the map.” And I would add, in the ever-changing markets, we can judge that similarity of structure only after the fact.
See the menu page Analytical Methods for a rundown on where to go for information on Elliott wave analysis.
By Tim Bovee, Portland, Oregon, August 2, 2024
Disclaimer
Tim Bovee, Private Trader tracks the analysis and trades of a private trader for his own accounts. Nothing in this blog constitutes a recommendation to buy or sell stocks, options or any other financial instrument. The only purpose of this blog is to provide education and entertainment.
No trader is ever 100 percent successful in his or her trades. Trading in the stock and option markets is risky and uncertain. Each trader must make trading decisions for his or her own account, and take responsibility for the consequences.
License
All content on Tim Bovee, Private Trader by Timothy K. Bovee is licensed under a Creative Commons Attribution-ShareAlike 4.0 International License.
Based on a work at www.timbovee.com.


You must be logged in to post a comment.