3:30 p.m. New York time
Half an hour before the closing bell. The S&P 500 futures peaked at 3637.50 during the session and then dropped back into the 3650s. Elliott Wave Theory: Wave 5, an uptrend that began on July 2, continues.
Internally, it’s difficult to analyze. The downward subwaves are quite shallow, and every conceivable upward movement that might count as a 3rd subwave is extraordinarily short. Usually, I’ve found, a third wave jumps out of the pattern with its easy-spot-length compared to the surrounding waves. Not so much within this 5th wave.
So I’m deferring judgment on the internal structure for now, waiting for some clarity.
I’ve updated the chart.
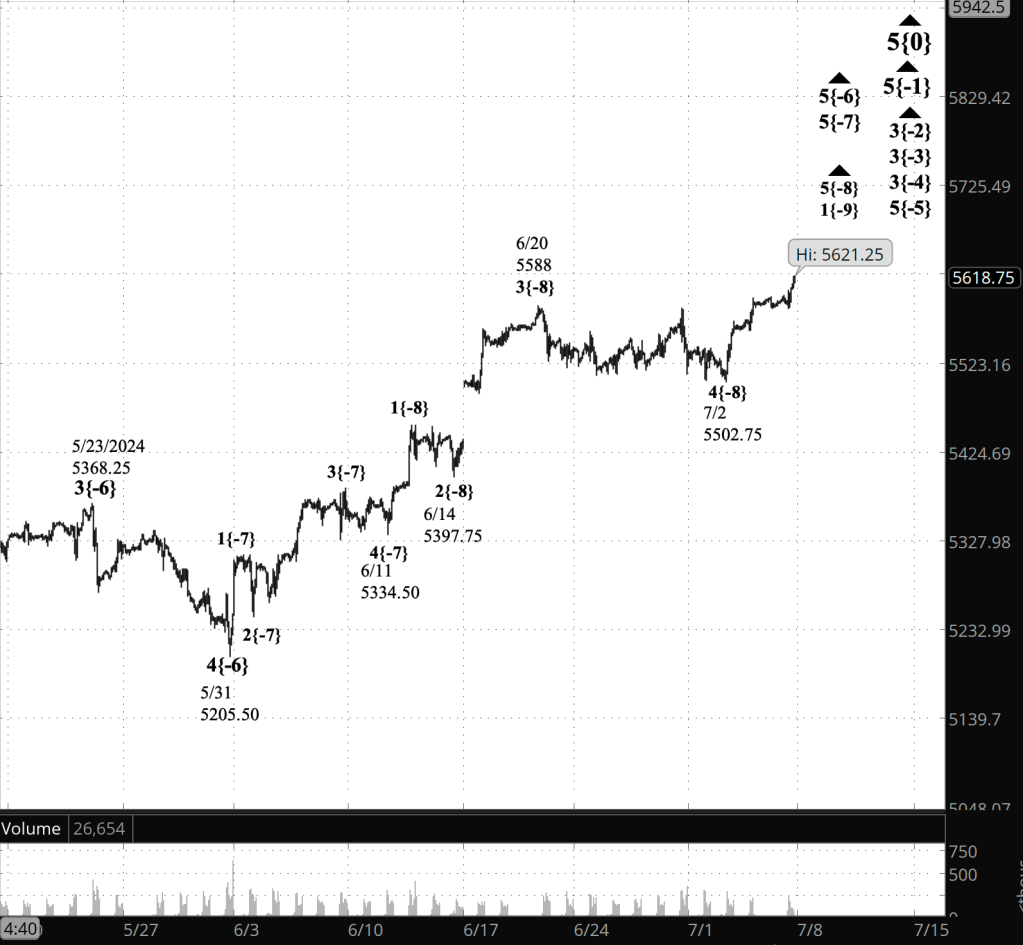
9:35 a.m. New York time
What’s happening now? The S&P 500 E-mini futures rose overnight reaching a new high in the 5630s shortly after the opening bell sounded.
What does it mean? Elliott Wave Theory (EWT) analysis sees the 5th-wave uptrend that began on July 2 continuing. EWT has no guidance on the length or duration of 5th waves, So far this 5th wave has covered around 120 points in seven calendar days. The preceding 3rd wave covered a bit less than 200 points in its entirely over six calendar days
A 5th wave’s personality can be quirky, with a far greater or far shorter length and duration than expected. In EWT terminology, it can either be extended or truncated. Or it can be a normie, an ordinary 5th wave that fits in with the other trending waves in the structure its part of. And there’s no way to tell ahead of time what sort of the 5th wave it will be.
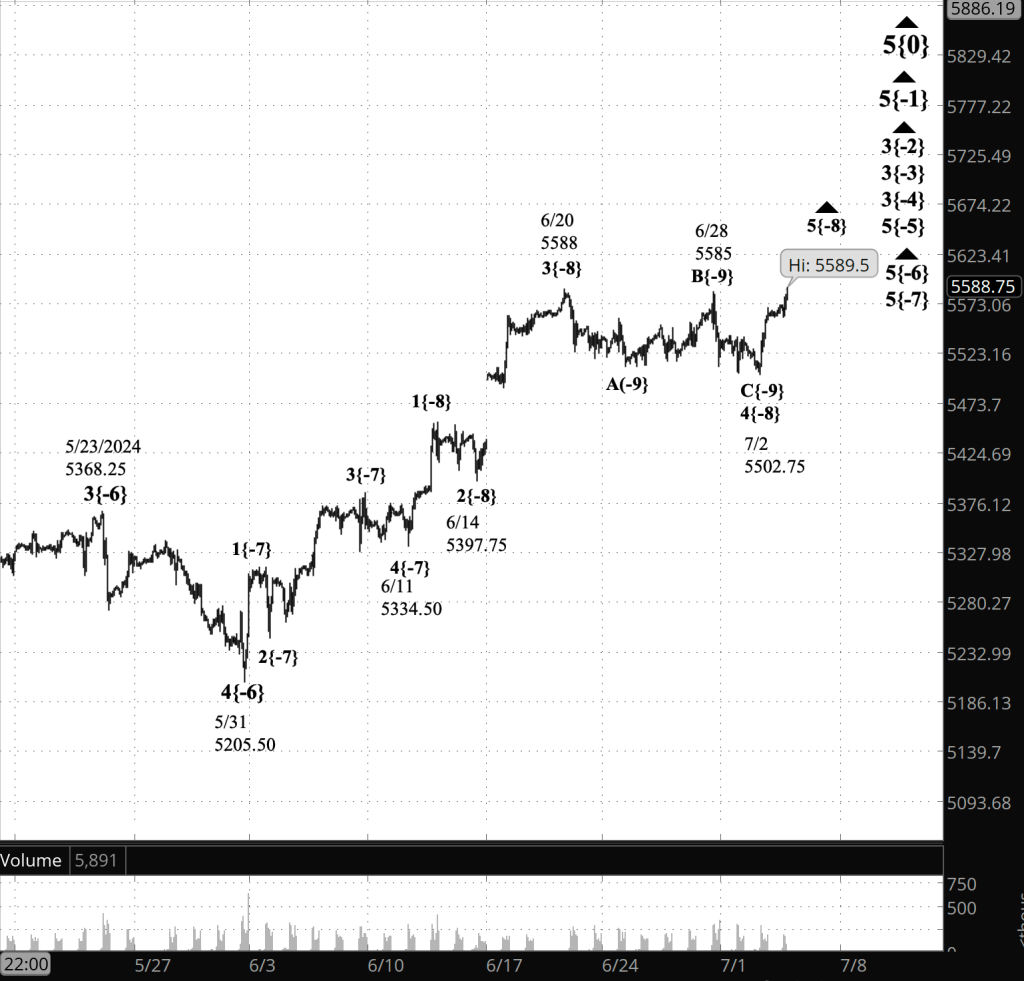
When the 5th wave is complete, it will also be the end of three larger 5th waves within the fractal structure of the chart, and also the end of a still larger 3rd wave that began on February 21 and has so far covered nearly 670 points.
A 4th-wave downward correction of a similar magnitude will follow.
What are the alternatives? There may be a 1st wave on the chart, between wave 5{-6} and 5{-5}. If that’s the proper count, then it would delay the onset or the 4th-wave downward correction, wave 4{-4}. See the June 18 Trader’s Notebook for a more detailed discussion.
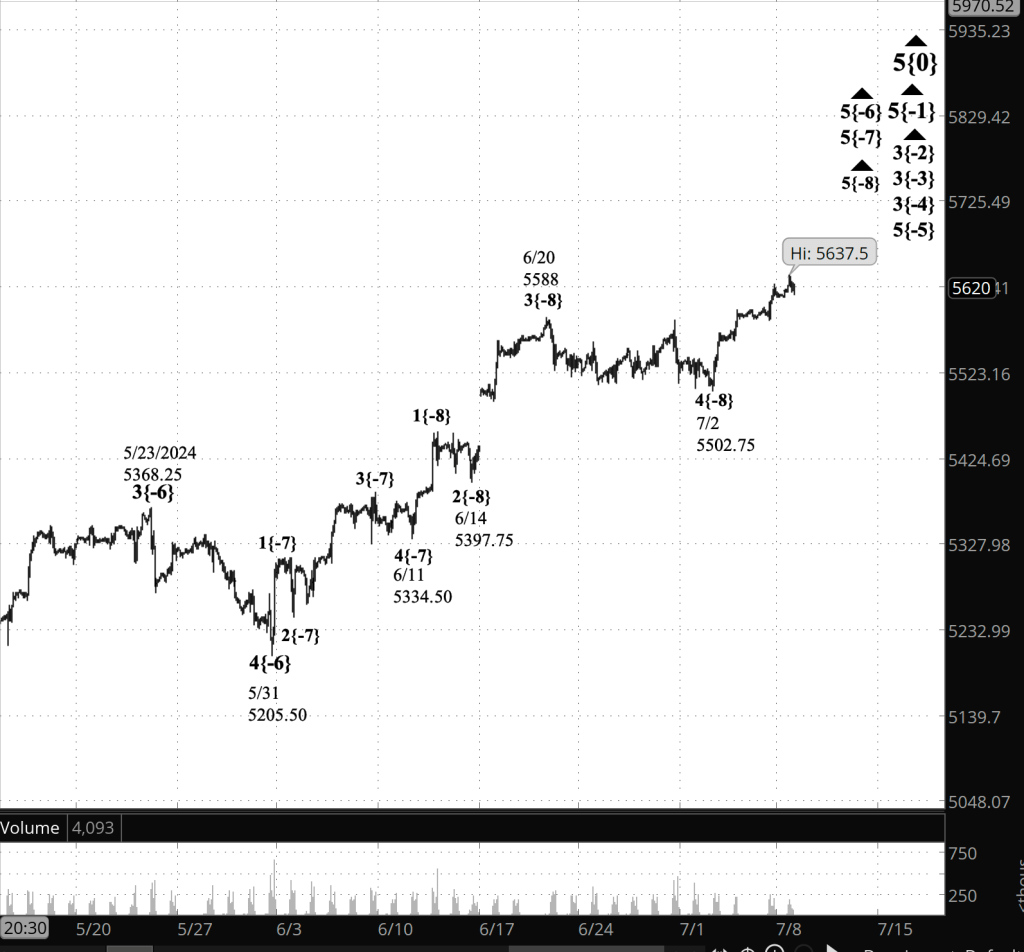
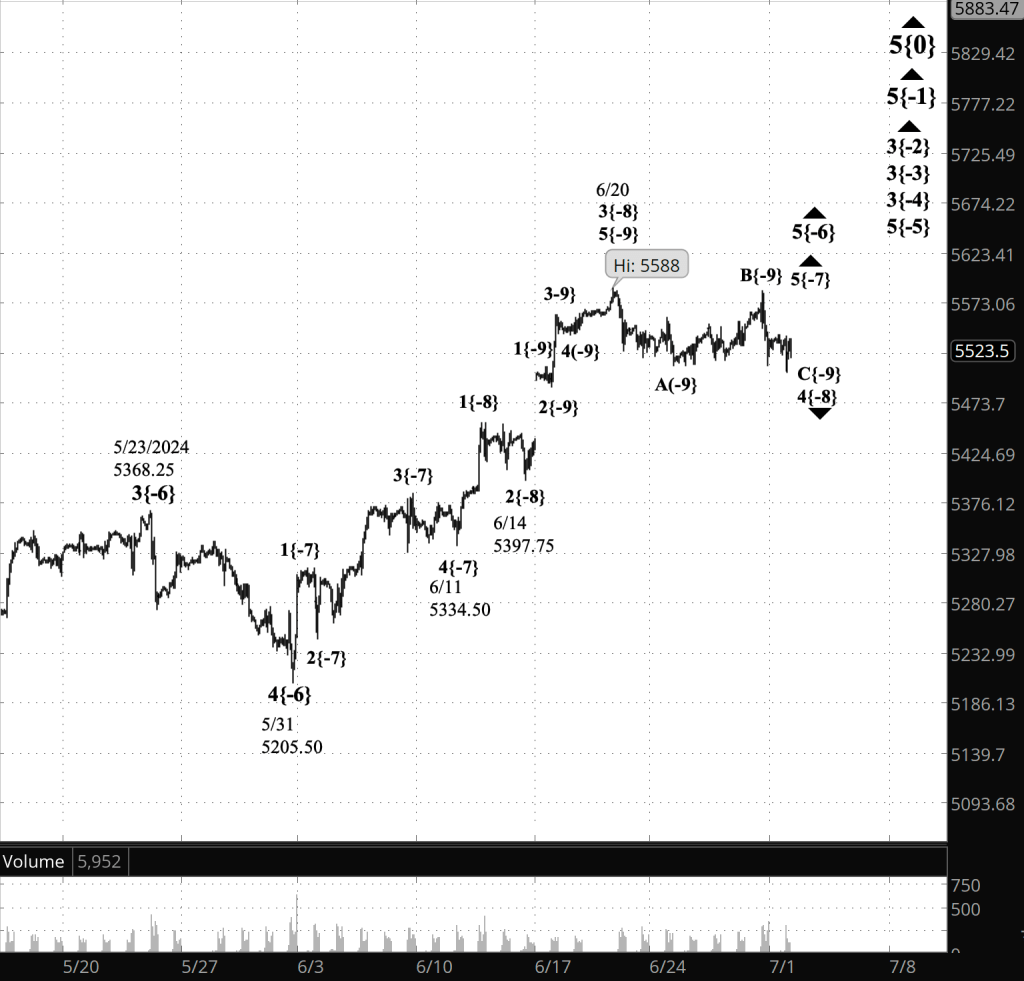
[S&P 500 E-mini futures at 3:30 p.m., 90-minute bars, with volume]
What does Elliott wave theory say? Here are the waves that underly the analyses.
Principal Analysis:
- Rising wave 5{0} is underway. It is a wave of Intermediate degree that began in December 2018.
- It is in its final subwave, wave 5{-1}.
- Within wave 5{-1}, rising waves 3{-2}, 3{-3} and 3{-4} are underway, as is wave 5{-5}.
- Wave 5{-6} is underway and is in its final subwave, uptrending wave 5{-7}, which in turn is in its final subwave, uptrending wave 5{-8}.
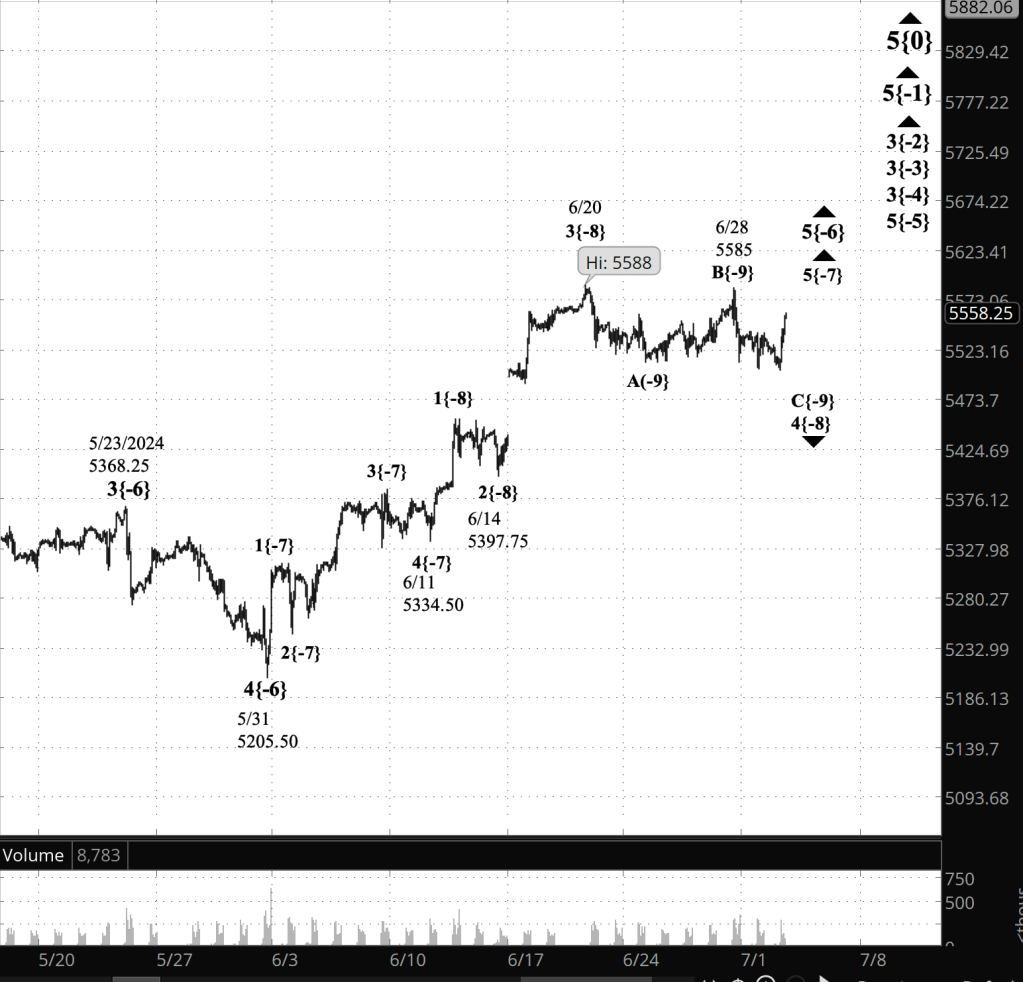
Reading the chart. Price movements — waves – – in Elliott wave analysis are labeled with numbers within trending waves and letters with corrective waves. The subscripts — numbers in curly brackets — designate the wave’s degree, which, in Elliott wave analysis, means the relative position of a wave within the larger and smaller structures that make up the chart. R.N. Elliott, who in the 1930s developed the form of analysis that bears his name, viewed the chart as a complex structure of smaller waves nested within larger waves, which in turn are nested within still larger waves. In mathematics it’s called a fractal structure, where at every scale the pattern is similar to the others.
Learning and other resources. Elliott wave analysis provides context, not prophecy. As the 20th century semanticist Alfred Korzybski put it in his book Science and Sanity (1933), “The map is not the territory … The only usefulness of a map depends on similarity of structure between the empirical world and the map.” And I would add, in the ever-changing markets, we can judge that similarity of structure only after the fact.
See the menu page Analytical Methods for a rundown on where to go for information on Elliott wave analysis.
By Tim Bovee, Portland, Oregon, July 8, 2024
Disclaimer
Tim Bovee, Private Trader tracks the analysis and trades of a private trader for his own accounts. Nothing in this blog constitutes a recommendation to buy or sell stocks, options or any other financial instrument. The only purpose of this blog is to provide education and entertainment.
No trader is ever 100 percent successful in his or her trades. Trading in the stock and option markets is risky and uncertain. Each trader must make trading decisions for his or her own account, and take responsibility for the consequences.
License
All content on Tim Bovee, Private Trader by Timothy K. Bovee is licensed under a Creative Commons Attribution-ShareAlike 4.0 International License.
Based on a work at www.timbovee.com.


You must be logged in to post a comment.