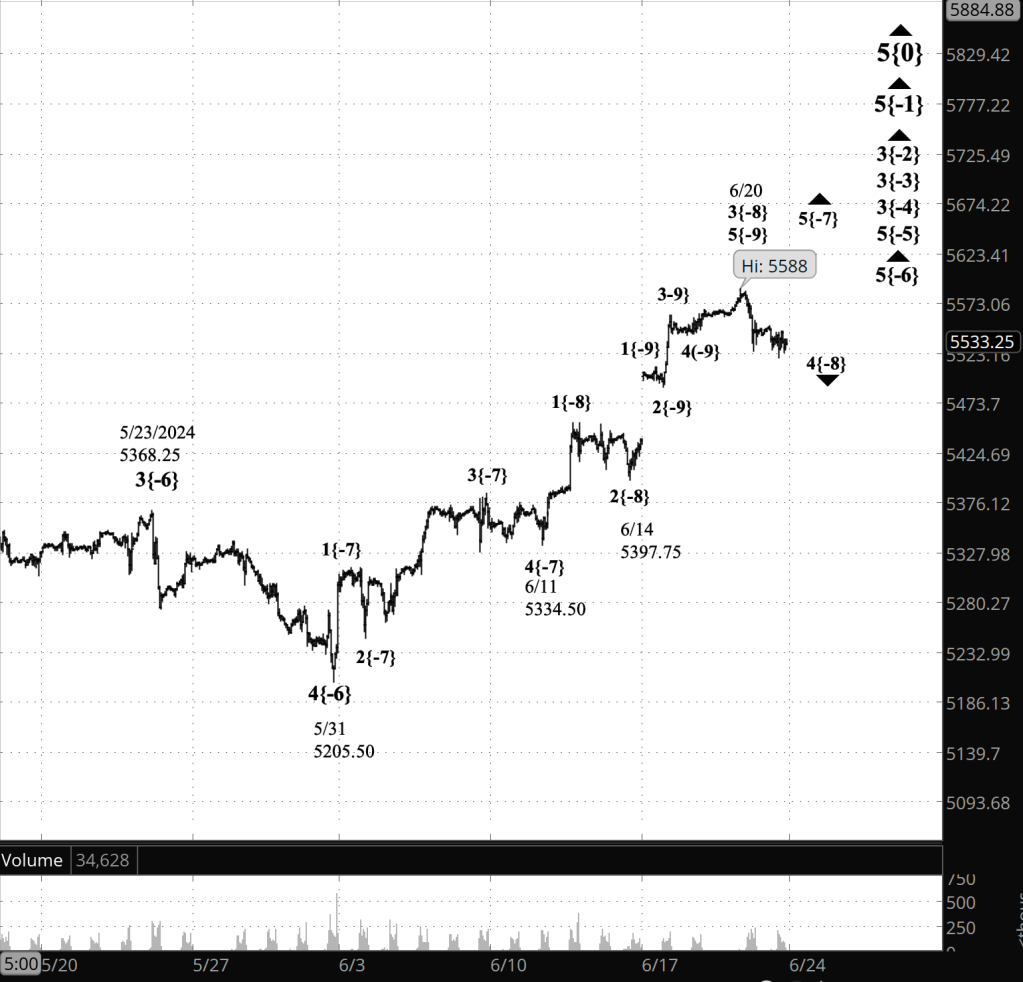
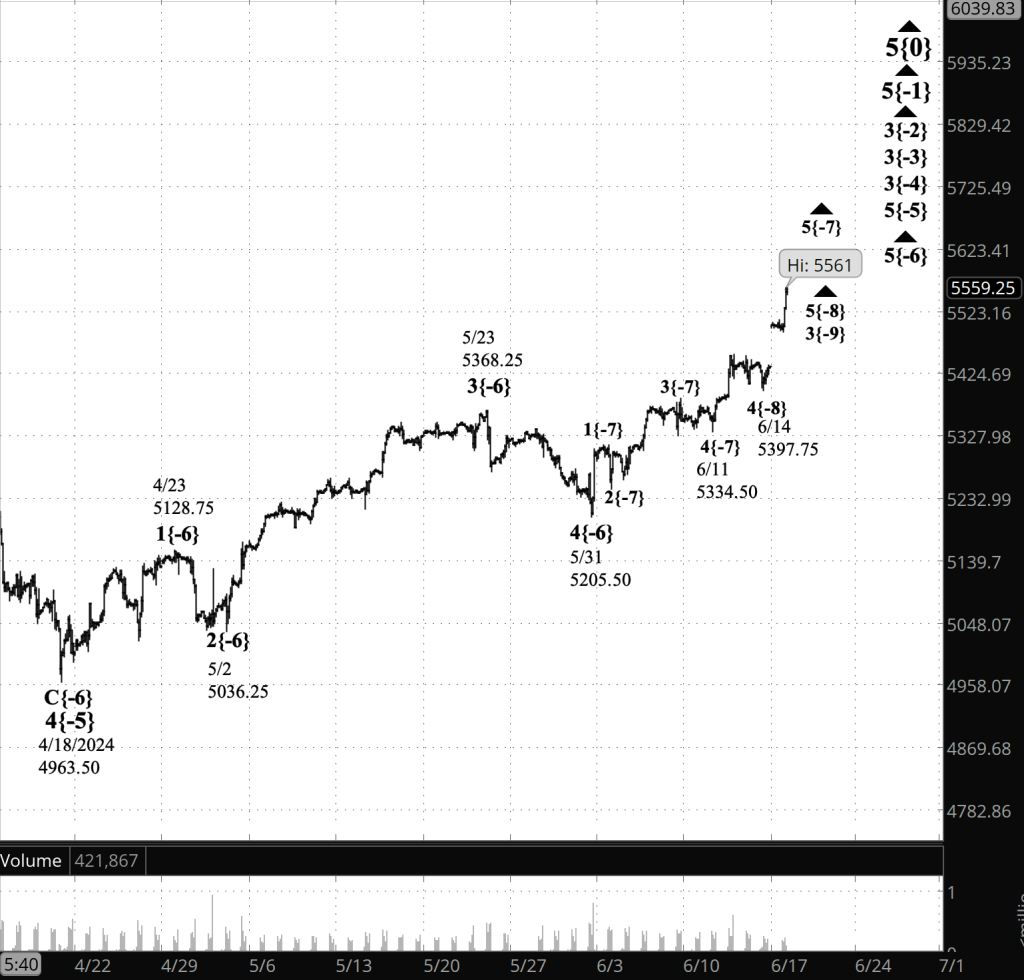
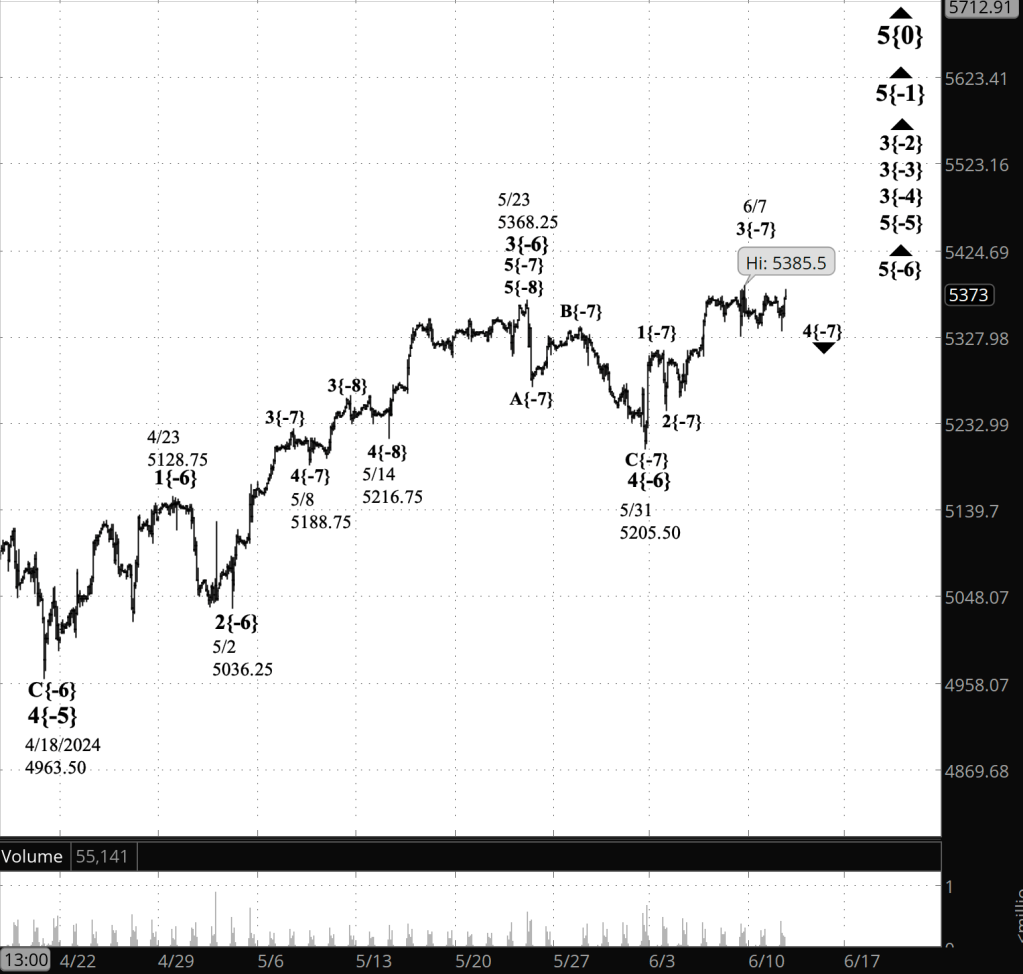
3:30 p.m. New York time
Half an hour before the closing bell. The S&P 500 futures fluctuated sideways during the session, remaining between the 5540s and the 5510s. Elliott Wave Theory: The 4th-wave downward correction within a larger 5th-wave uptrend continues. The 5th wave began on June 11, and the 4th wave, on June 20.
I’ve updated the chart.
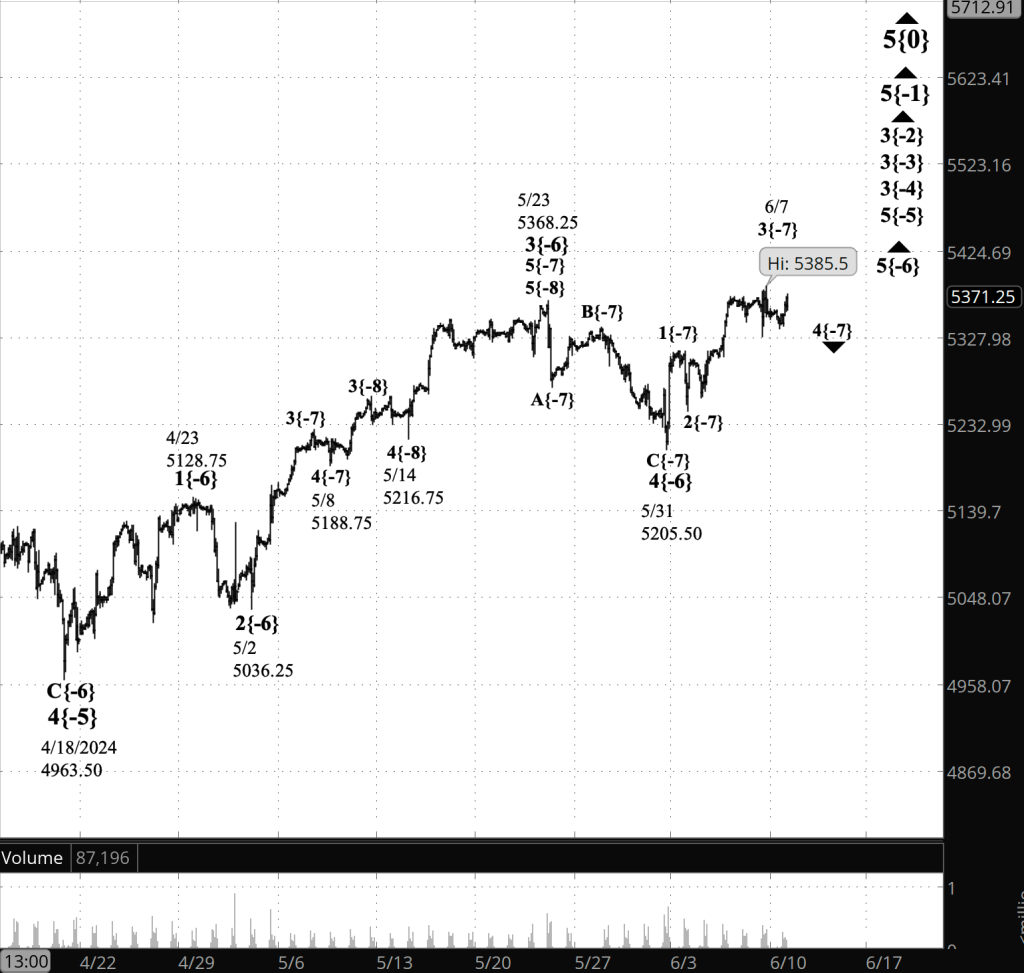
9:35 a.m. New York time
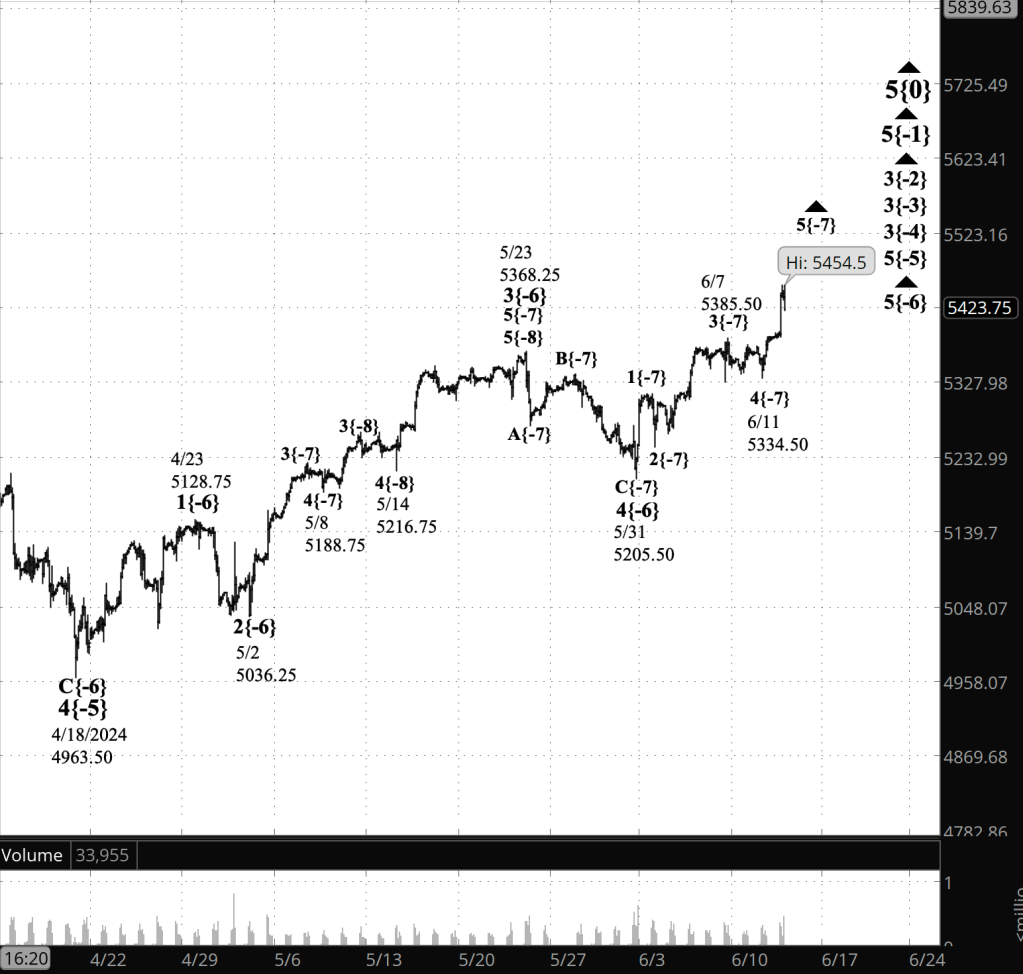
What’s happening now? The S&P 500 E-mini futures fell from the 5550s to the 5520s overnight.
What does it mean? I’ve moved the chart in for a closer view, and it clarifies the Elliott Wave Theory analysis: The uptrend that began on June 11 has completed its 3rd subwave and is now in a low-degree 4th-wave downward correction.
When that correction is complete, a 5th wave will follow, completing the June 11 5th wave and cascading up the fractal structure of chart, also completing 5th waves three degrees higher and a 3rd wave four degrees higher.
That larger 3rd wave, which began on February 21 from 4959, will be followed by a 4th-wave downward correction of similar magnitude.
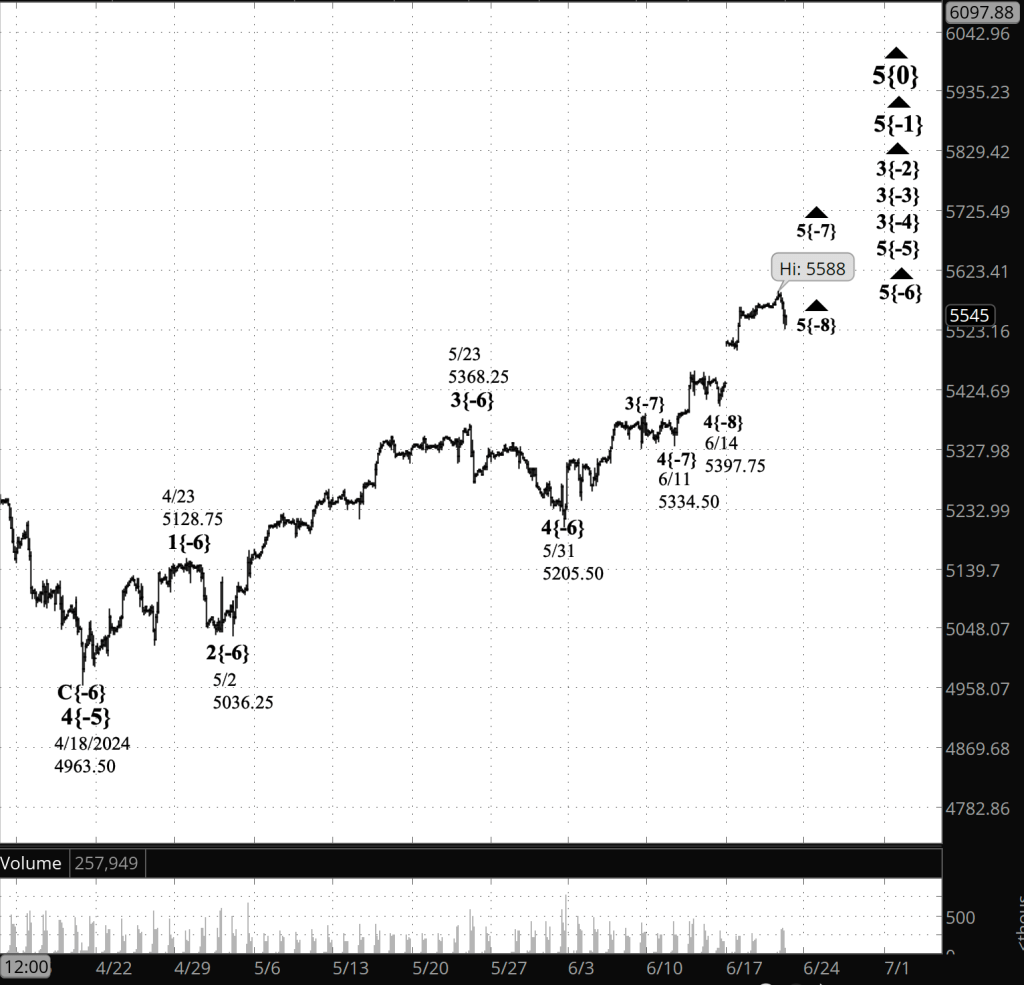
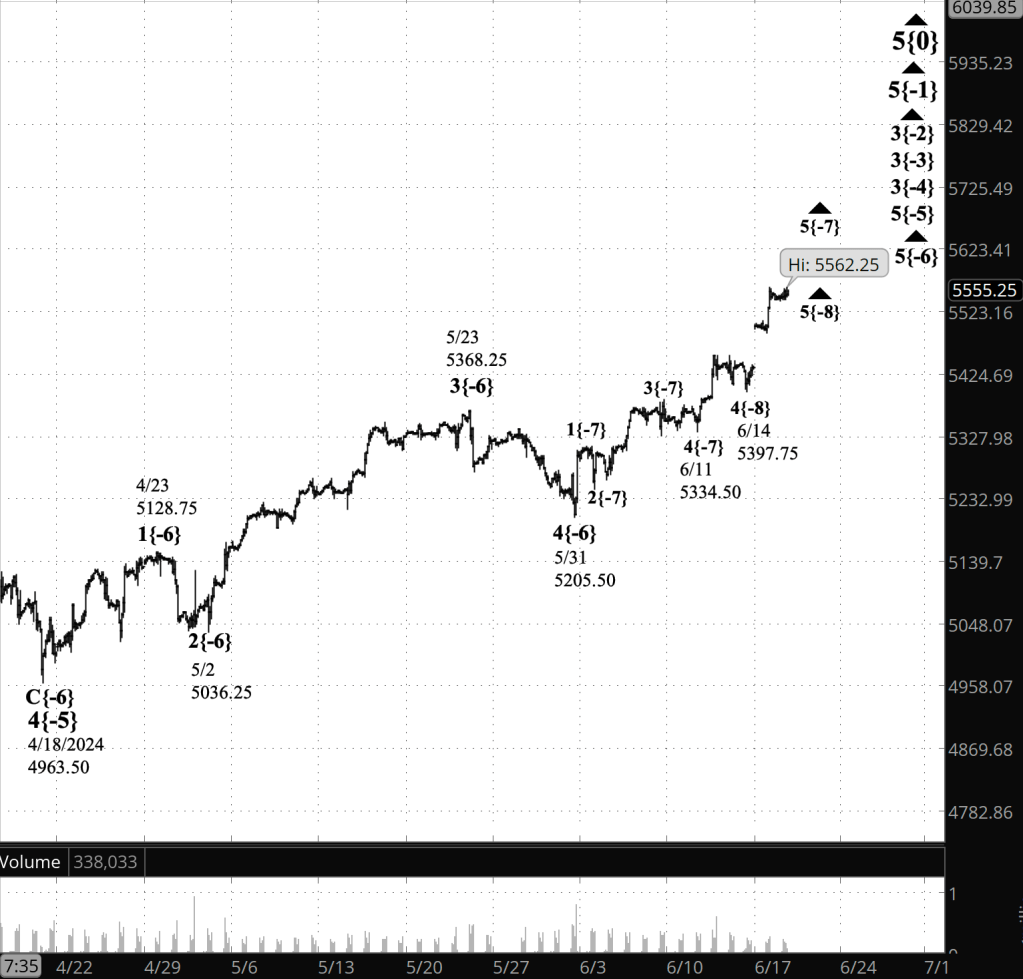
On the chart, each wave is marked with a wave number and a subscript in curly brackets showing the wave’s distance in fractal degrees from the Intermediate degree. The present Intermediate degree, wave 5{0}, began in December 2018.
Working down from the largest wave discussed in the analysis, from the 3rd-wave that began on February 21, the waves appear on the chart as waves 3{-4}, 5{-5}, 5{-6} and 5{-7}. Within wave 5{-7}, wave 4{-8}, a downward correction, is underway.
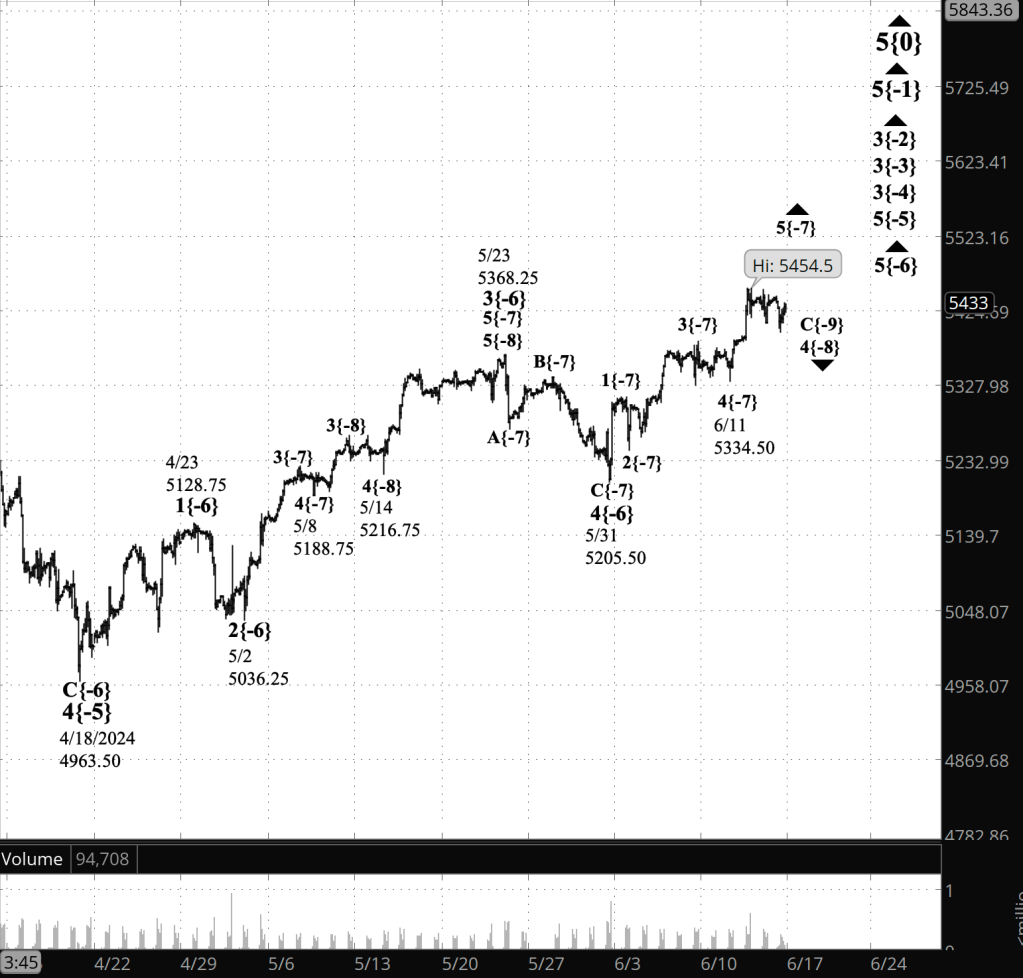
Seee the June 22 Trader’s Notebook for a broader view of the chart, reaching back to the beginning of wave 5{-6} on May 31.
What are the alternatives? Unchanged from the day before. There may be a 1st wave on the chart, between wave 5{-6} and 5{-5}. If that’s the proper count, then it would delay the onset or the 4th-wave downward correction, wave 4{-4}. See the June 18 Trader’s Notebook for a more detailed discussion.
[S&P 500 E-mini futures at 3:30 p.m., 1-hour bars, with volume]
What does Elliott wave theory say? Here are the waves that underly the analyses.
Principal Analysis:
- Rising wave 5{0} is underway. It is a wave of Intermediate degree that began in December 2018.
- It is in its final subwave, wave 5{-1}.
- Within wave 5{-1}, rising waves 3{-2}, 3{-3} and 3{-4} are underway, as is wave 5{-5}.
- Wave 5{-6} is underway and is in its final subwave, uptrending wave 5{-7} and its subwave, downtrending wave 4{-8}, a corrective wave.
Reading the chart. Price movements — waves – – in Elliott wave analysis are labeled with numbers within trending waves and letters with corrective waves. The subscripts — numbers in curly brackets — designate the wave’s degree, which, in Elliott wave analysis, means the relative position of a wave within the larger and smaller structures that make up the chart. R.N. Elliott, who in the 1930s developed the form of analysis that bears his name, viewed the chart as a complex structure of smaller waves nested within larger waves, which in turn are nested within still larger waves. In mathematics it’s called a fractal structure, where at every scale the pattern is similar to the others.
Learning and other resources. Elliott wave analysis provides context, not prophecy. As the 20th century semanticist Alfred Korzybski put it in his book Science and Sanity (1933), “The map is not the territory … The only usefulness of a map depends on similarity of structure between the empirical world and the map.” And I would add, in the ever-changing markets, we can judge that similarity of structure only after the fact.
See the menu page Analytical Methods for a rundown on where to go for information on Elliott wave analysis.
By Tim Bovee, Portland, Oregon, June 21, 2024
Disclaimer
Tim Bovee, Private Trader tracks the analysis and trades of a private trader for his own accounts. Nothing in this blog constitutes a recommendation to buy or sell stocks, options or any other financial instrument. The only purpose of this blog is to provide education and entertainment.
No trader is ever 100 percent successful in his or her trades. Trading in the stock and option markets is risky and uncertain. Each trader must make trading decisions for his or her own account, and take responsibility for the consequences.
License
All content on Tim Bovee, Private Trader by Timothy K. Bovee is licensed under a Creative Commons Attribution-ShareAlike 4.0 International License.
Based on a work at www.timbovee.com.


You must be logged in to post a comment.