3:30 p.m. New York time
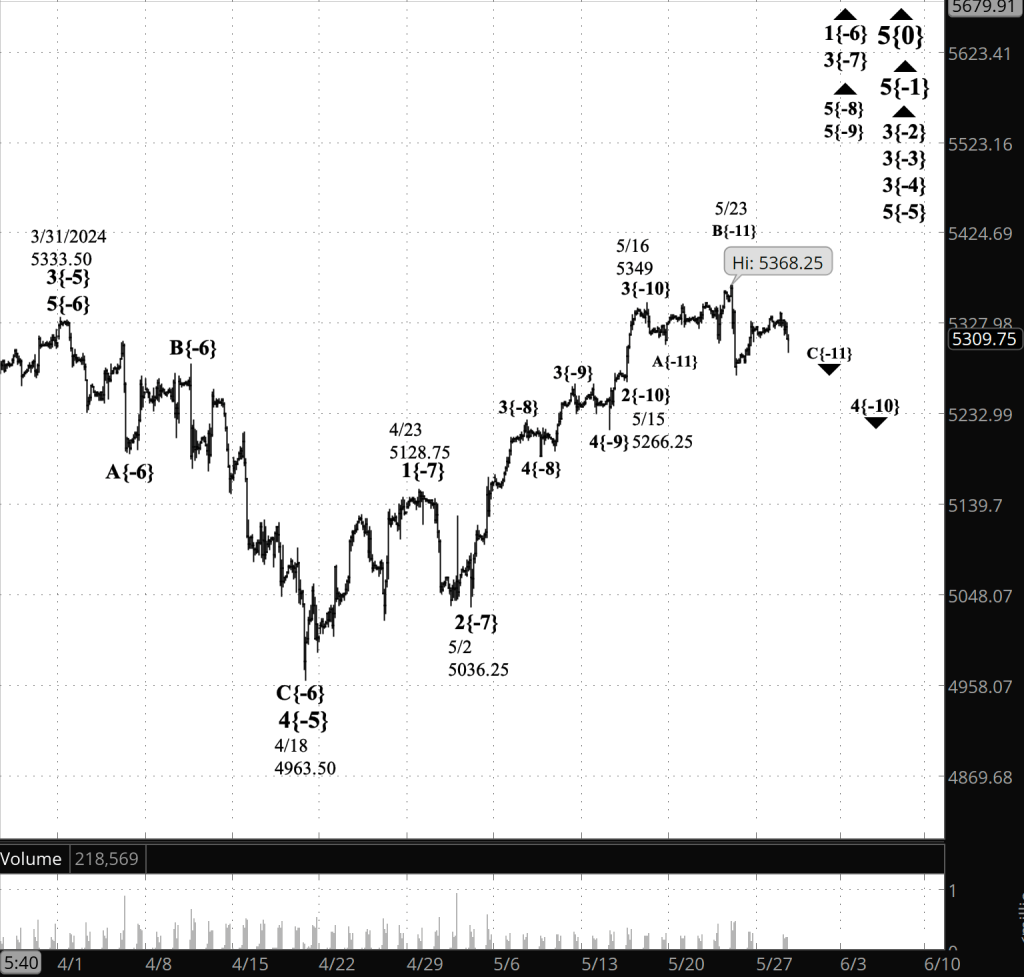
Half an hour before the closing bell. The S&P 500 futures have fallen back to the 5340s during the session. Elliott Wave Theory: The decline is the 4th subwave within the uptrending 3rd wave within the 5th-wave uptrend that began on May 31.
I’ve updated the chart.
9:35 a.m. New York time
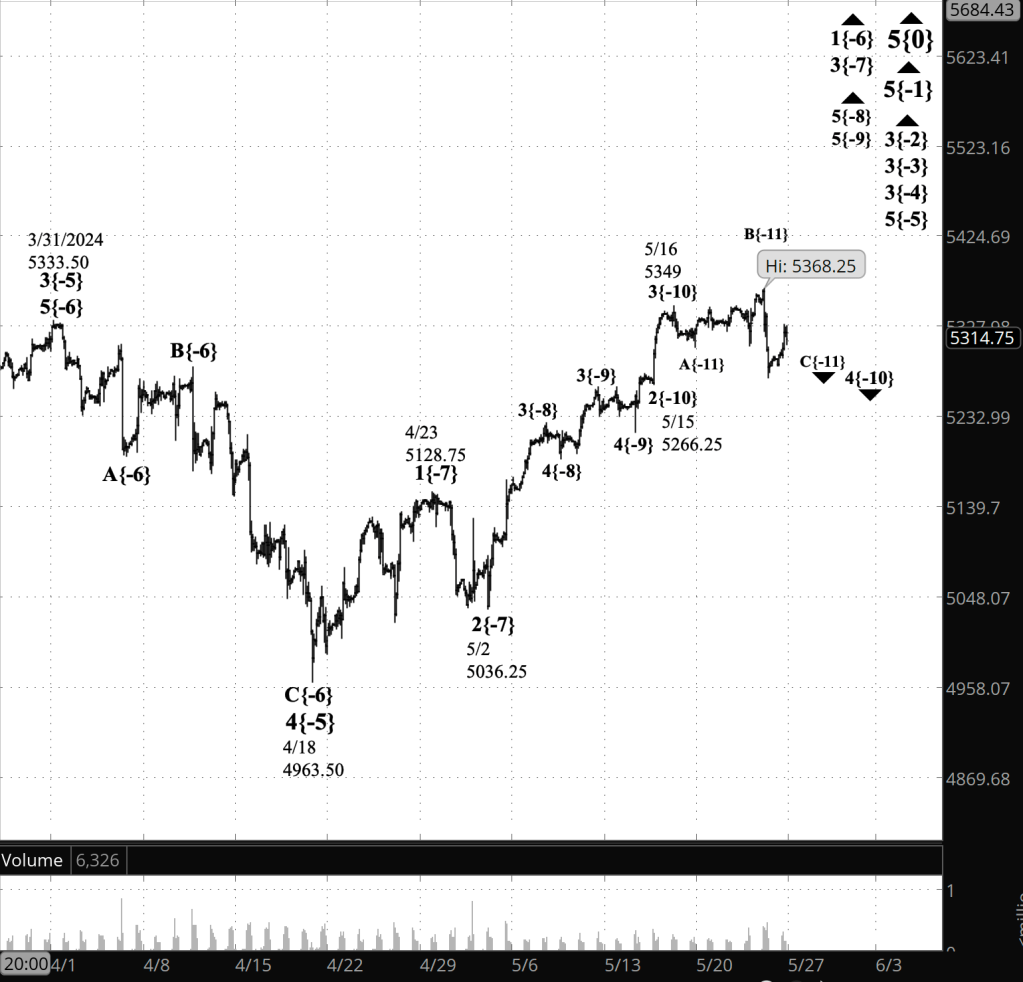
What’s happening now? The S&P 500 E-mini futures peaked early overnight at 5372.75 and then traded narrowly, dropping as low as the 5350s.
What does it mean. The peak, 5372.75, may well be the end of the 3rd subwave within a 5th-wave uptrend that began on May 31 under the revised Elliott Wave analysis described below. Although not necessarily. It could just as well be a stopping point within wave 3.
The map is not the territory. The 4th wave downward correction that I’ve been tracking mid-May broke a rule of Elliott Wave Theory. It moved beyond the end of the previous 1st wave. if that happens, then it’s not a 4th wave but something else.
Moreover, the rise during the June 5 session showed an energy typical a 3rd or 5th wave, subwaves of a larger trending wave.
In every edition of Trader’s Notebook, I quote the 20th century semanticist Alfred Korzybski. In his book Science and Sanity (1933), he wrote: “The map is not the territory … The only usefulness of a map depends on similarity of structure between the empirical world and the map.”
And by implication, when the map no longer matches the territory — when the Elliott Wave analysis no longer matches the chart — then it’s time to draw a new map, to work our way through a new analysis.
Elliott Wave Theory is an exercise in pattern recognition. It’s true that the human brain is one of the best pattern recognition devices around. It’s also true that it is highly subjective in its conclusions. That’s human nature. And because of that characteristic, revisions are rare, and they must be embraced by the analyst without delay.
Wave labels. In this discussion I’ll use the wave labelling system that appears on the chart. Each wave number is followed by a subscript, in curly brackets, that tells waves distance from what Elliott Wave Theory calls the Intermediate degree. The present Intermediate degree, wave 5{0}, began in December 2018. A wave with {-6} in the brackets would be six degrees lower than Intermediate, what Elliott Wave Theory call the Submicro degree. It’s a way of distinguishing waves by their location in the fractal structure traced by stock prices.
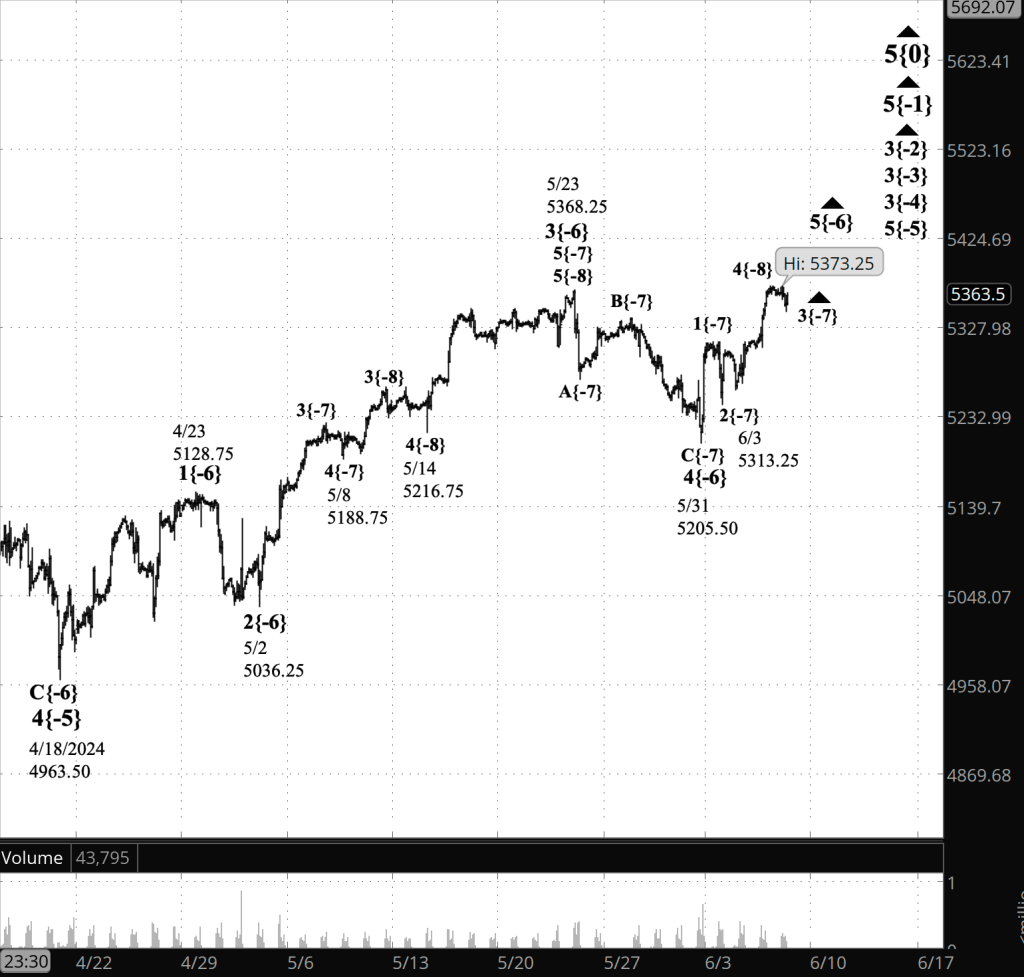
[S&P 500 E-mini futures at 3:30 p.m., 90-minute bars, with volume]
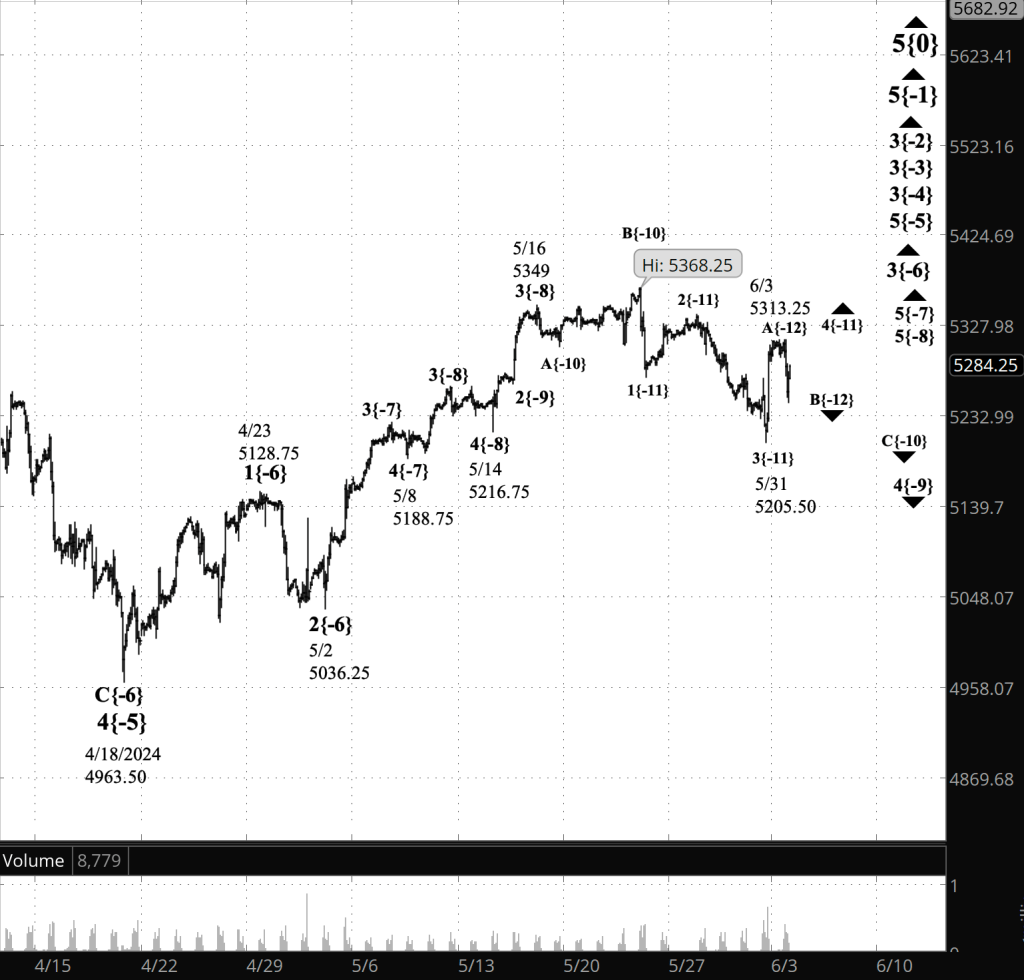
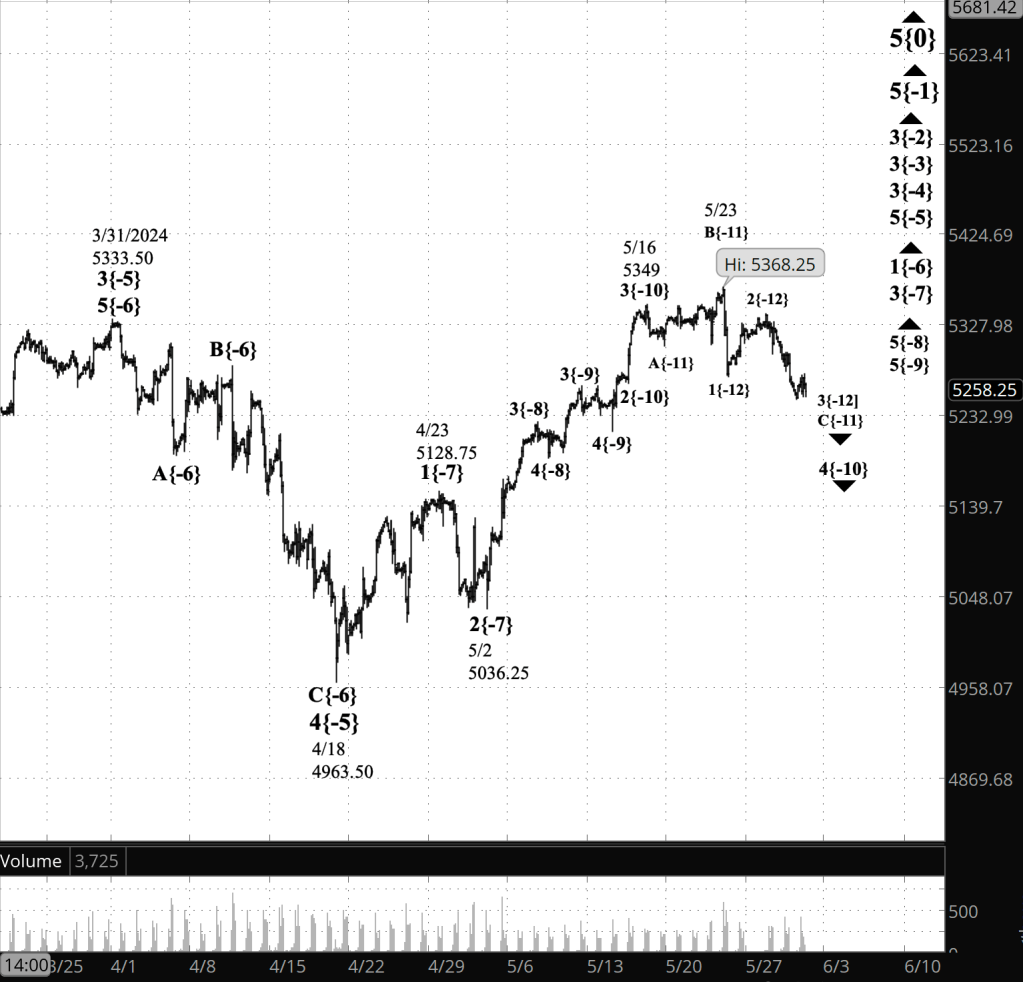
The new analysis. The former analysis had wave C{-12}, the larger final subwave within a 4th-wave upward correction, wave 4{-11}, within the final subwave, wave C{-10}, of a downward correction, wave 4{-9}. It’s that wave 4{-9} that broke the Elliott Wave Theory rule described above, a 4th wave never moves beyond the end of the preceding 1st wave..[S&P 500 E-mini futures at 9:35 a.m., 90-minute bars, with volume]
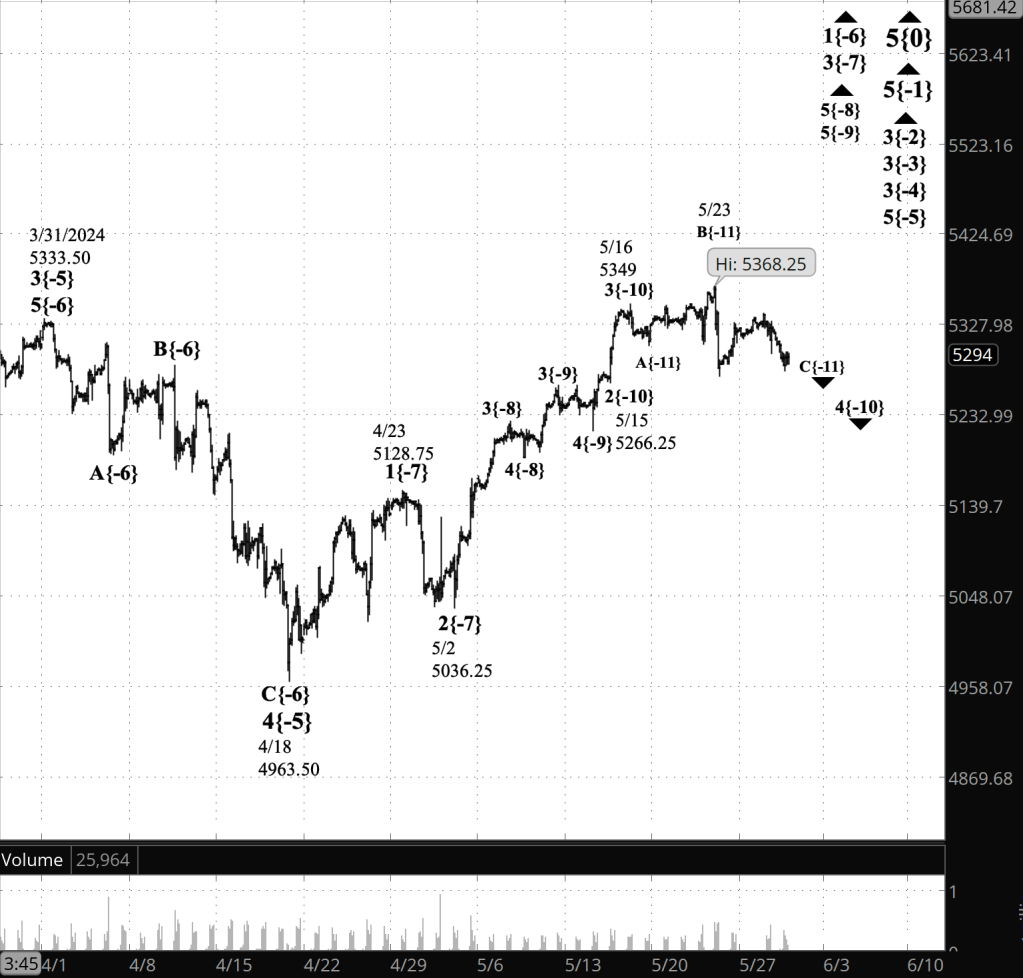
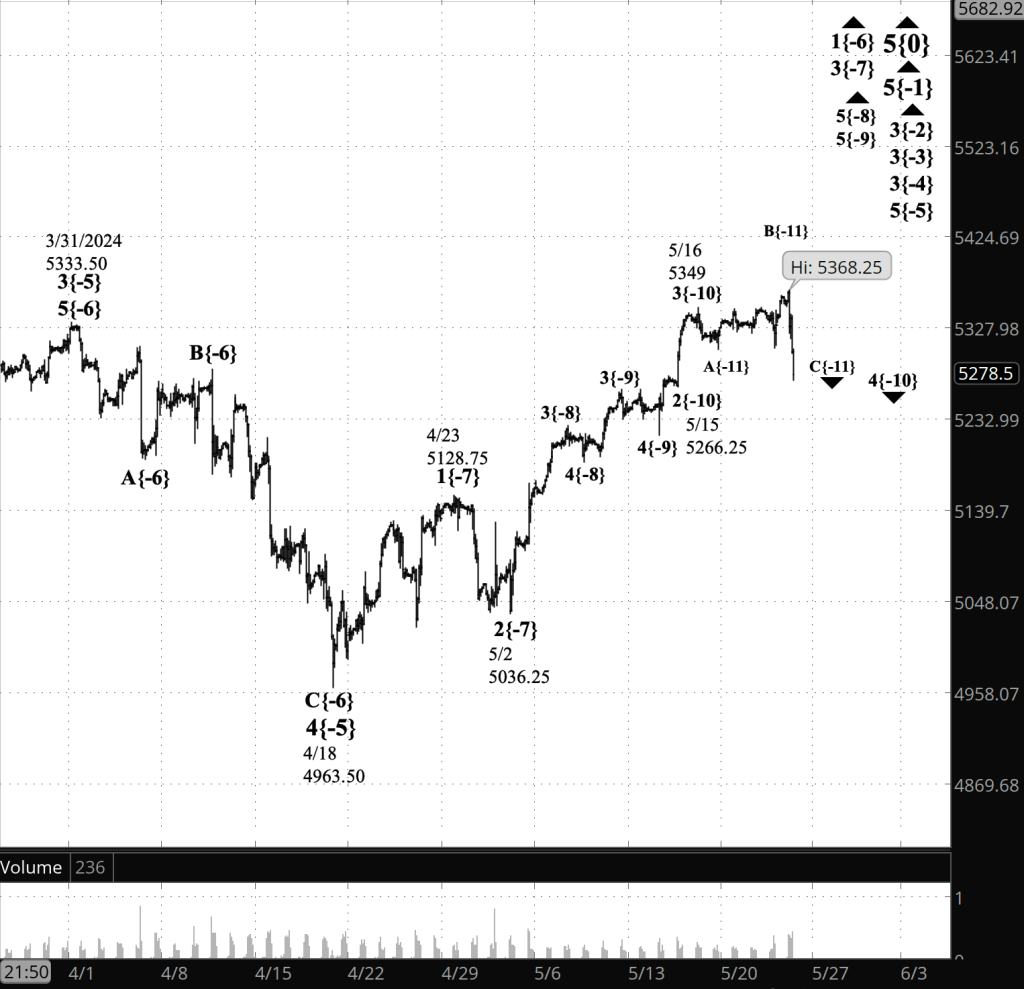
The solution was to move the subwaves up by several degrees, bringing the correction into compliance with the rule. I did this by reworking the wave count within what had been wave 3{-6}, which was still under, so that wave 3{-6} ended on May 23, which in the prior analysis was the end of wave B{-10}.
That cleared the for the following decline to be a 4th wave, wave 4{-6}, and the push upward that began on May 31 to be wave 5{-6}, a subwave within uptrending wave 5{-5}, which began on April 18.
For a comparison with the prior principal analysis’ chart, look at the June 5 edition of Trader’s Notebook.
Implications for the future. Under the new principal analysis, the end of wave 5{-6} will also be the end of wave 5{-5} and its parent wave 3{-4}, which began on February 21 from 4959. Wave 3{-4} will be followed by a 4th-wave downward correction significantly larger than the 4th-wave corrections I’ve been tracking for the past months.
In terms of the strategic reality of the chart, very little has changed. With both the former and revised analyses, a 4th wave is nearing its end and an uptrending 5th wave is expected to follow. Under the new analysis, the 4th wave ended on May 31 and the uptrend has begun.
What are the alternatives? I’ve labeled the 5th-wave uptrend now underway as wave 5{-6}. It’s also plausible that the wave is a subwave one degree lower than 5{-6}, meaning the fractal tree would be wave 3{-8} within wave 1{-7} within wave 5{-6}, rather than what principal analysis labeling: Wave 3{-7} within wave 5{-6}.
What does Elliott wave theory say? Here are the waves that underly the new analysis.
Principal Analysis:
- Rising wave 5{0} is underway. It is a wave of Intermediate degree that began in December 2018.
- It is in its final subwave, wave 5{-1}.
- Within wave 5{-1}, rising waves 3{-2}, 3{-3} and 3{-4} are underway, as is wave 5{-5}.
- Wave 5{-6} is underway and is in its middle subwave, wave 3{-7}.
Reading the chart. Price movements — waves – – in Elliott wave analysis are labeled with numbers within trending waves and letters with corrective waves. The subscripts — numbers in curly brackets — designate the wave’s degree, which, in Elliott wave analysis, means the relative position of a wave within the larger and smaller structures that make up the chart. R.N. Elliott, who in the 1930s developed the form of analysis that bears his name, viewed the chart as a complex structure of smaller waves nested within larger waves, which in turn are nested within still larger waves. In mathematics it’s called a fractal structure, where at every scale the pattern is similar to the others.
Learning and other resources. Elliott wave analysis provides context, not prophecy. As the 20th century semanticist Alfred Korzybski put it in his book Science and Sanity (1933), “The map is not the territory … The only usefulness of a map depends on similarity of structure between the empirical world and the map.” And I would add, in the ever-changing markets, we can judge that similarity of structure only after the fact.
See the menu page Analytical Methods for a rundown on where to go for information on Elliott wave analysis.
By Tim Bovee, Portland, Oregon, June 6, 2024
Disclaimer
Tim Bovee, Private Trader tracks the analysis and trades of a private trader for his own accounts. Nothing in this blog constitutes a recommendation to buy or sell stocks, options or any other financial instrument. The only purpose of this blog is to provide education and entertainment.
No trader is ever 100 percent successful in his or her trades. Trading in the stock and option markets is risky and uncertain. Each trader must make trading decisions for his or her own account, and take responsibility for the consequences.
License
All content on Tim Bovee, Private Trader by Timothy K. Bovee is licensed under a Creative Commons Attribution-ShareAlike 4.0 International License.
Based on a work at www.timbovee.com.


You must be logged in to post a comment.