3:30 p.m. New York time
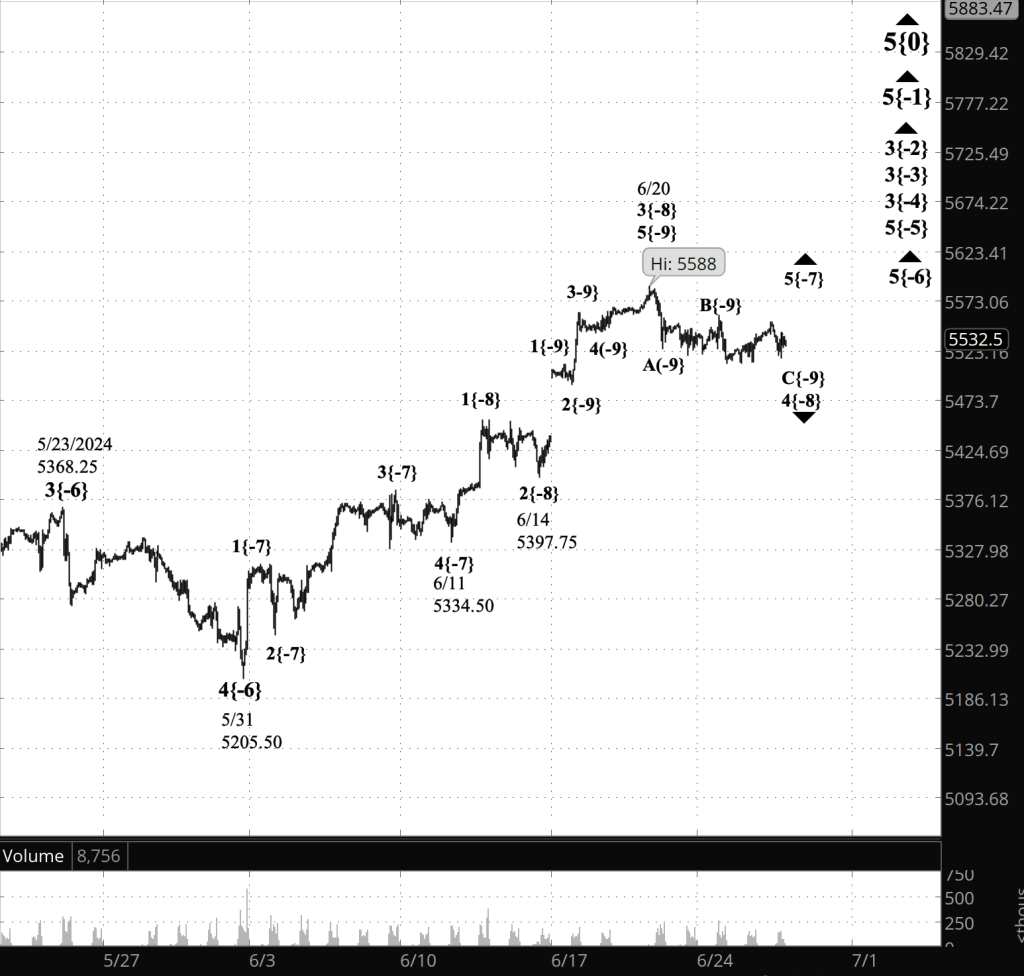
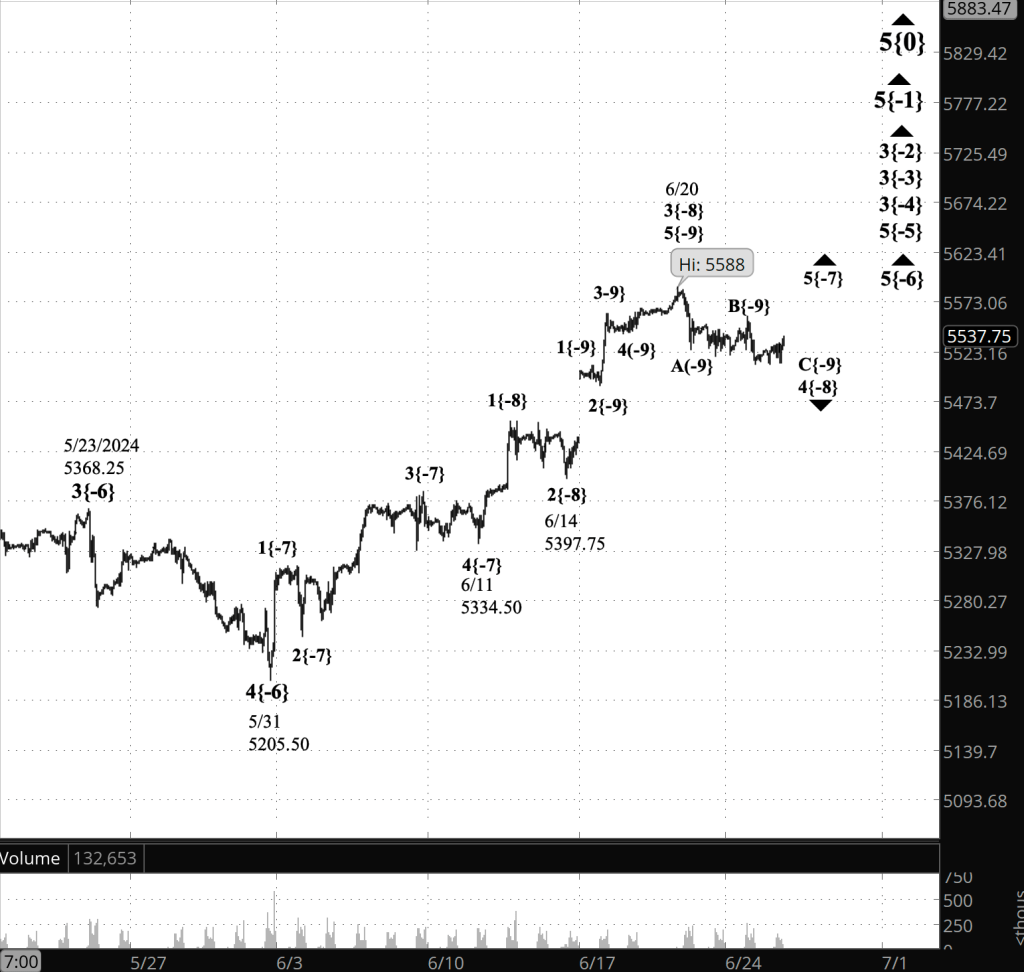
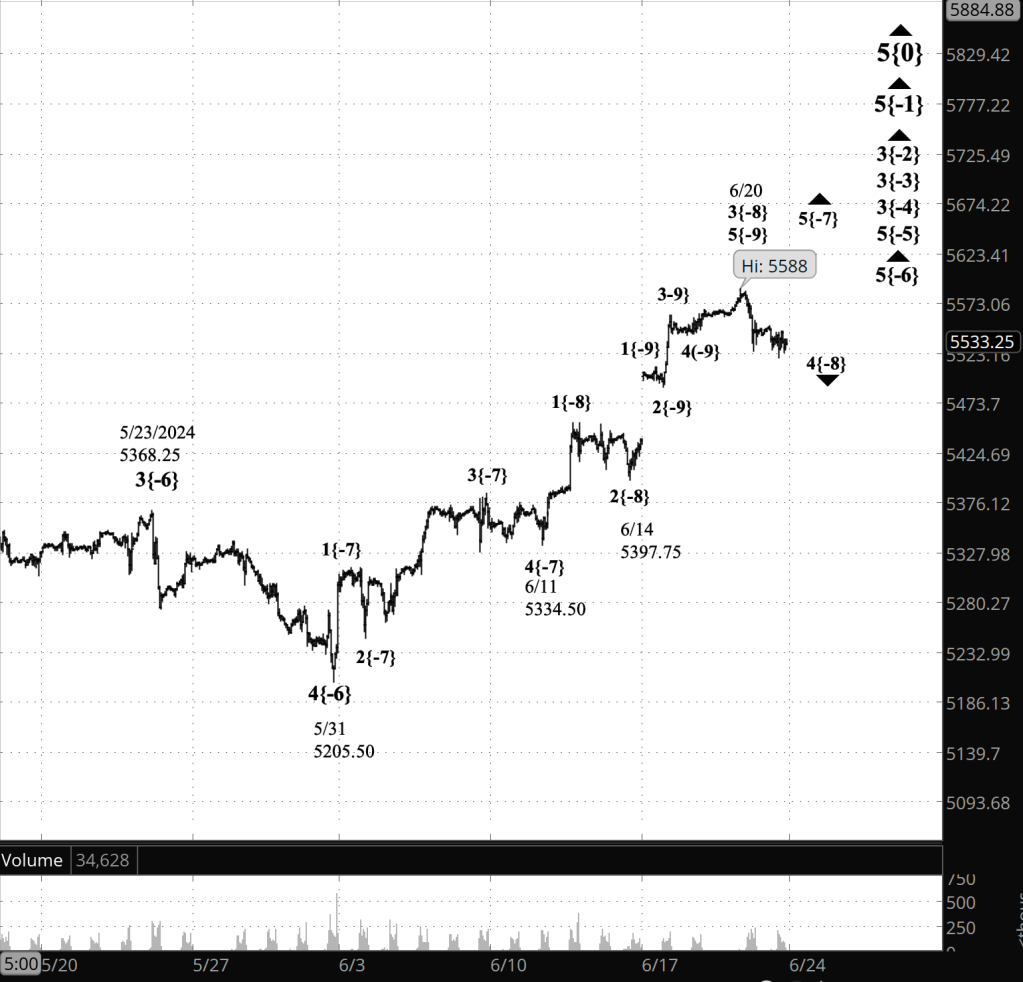
Half an hour before the closing bell. The S&P 500 futures rose during the session, reaching above the overnight high to 5621.25. Elliott Wave Analysis: The rise is a 5th-wave uptrend that began on July 2. the wave has traveled to the upside with sufficient clarity that I’m removing the alternative analysis that saw a possibility that the rise was a subwave of the preceding 4th-wave downward correction.
I’ve updated the chart.
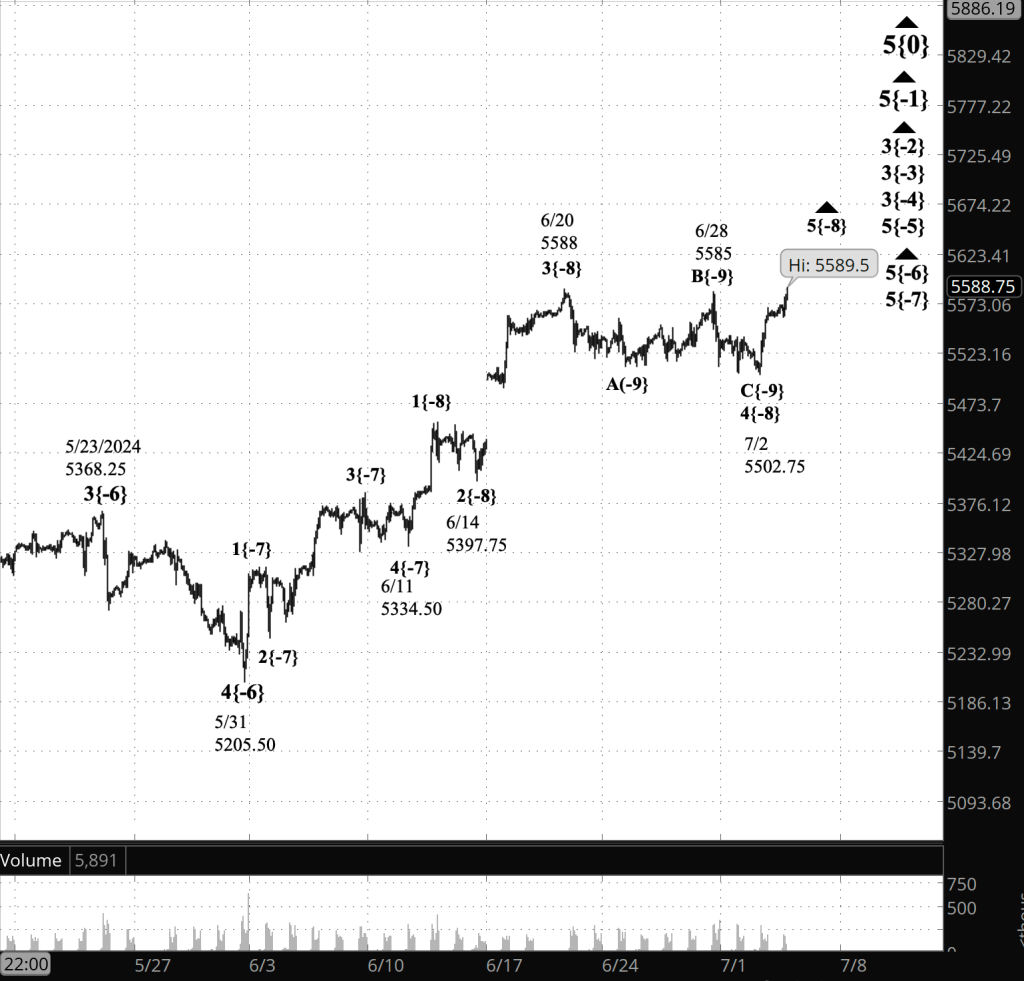
9:35 a.m. New York time
What’s happening now? The S&P 500 E-mini futures fluctuated gently around 5590 after trading resumed overnight, until the release of the Employment Situation Report for June, when the price zigzagged in the span of a minute, down into the 5580s and up to a new high above 5600. Thereafter it swiftly returned to the 5590s, where it stayed as the opening bell approached.
What does it mean? Elliott Wave Theory sees the new high, 5605, as further evidence that a 5th-wave uptrend began on July 2. The subwaves within the early stages of a trend can be frustratingly ambiguous. I see the wave 5 uptrend as being in its 1st subwave, but would be unsurprised if the count turned out differently.
The 5th wave is relatively small, but it will have an outsized impact, as 5th waves tend to do. A 5th wave is about endings, and new beginnings. In the fractal structure of the chart, each wave is nested within a series of ongoing waves, each larger than the one before it, and in turn ecnompasses a series of nested series of smaller waves, each smaller than the one before it.
A small 5th wave gains power when it is nested within a series of larger 5th waves. The 5th wave that began on July 2 from 5502.75 is a subwave of three larger 5th waves, up to the wave that began on April 18 from 4963.50. That largest 5th wave in the series is a subwave of a still larger 3rd wave that began on February 21 from 4959.
The end of the present small subwave, the one that began three days ago, will also be the end of the three larger subwaves and of the third wave that began in the winter winds of February.
What comes next? A 4th-wave downward correction, four levels higher in the fractal structure than the small 4th-wave downward correction that ended three days ago.
What are the alternatives? It’s still possible, although it’s less likely by the day, that the new 5th wave is a head-fake and the 4th-wave downward correction is continuing. [Note: I’ve eliminated this alternative.]
There may be a 1st wave on the chart, between wave 5{-6} and 5{-5}. If that’s the proper count, then it would delay the onset or the 4th-wave downward correction, wave 4{-4}. See the June 18 Trader’s Notebook for a more detailed discussion.
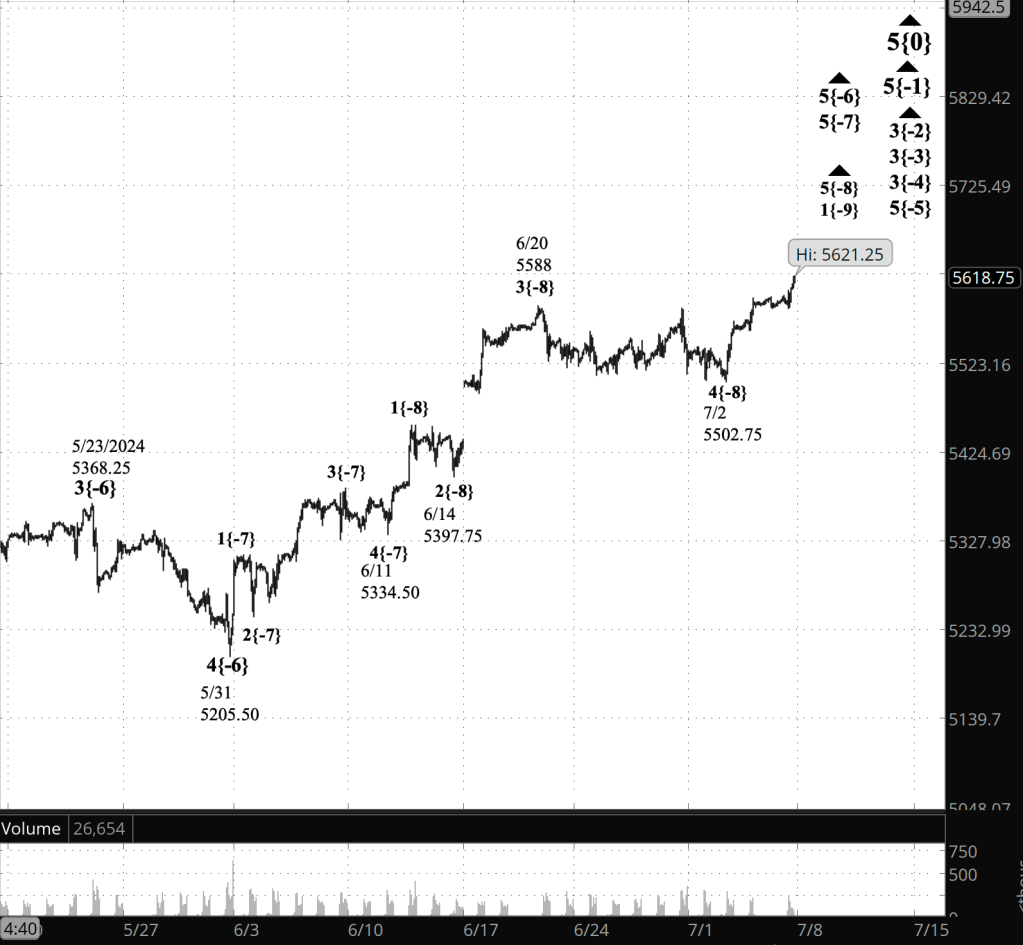
[S&P 500 E-mini futures at 3:30 p.m., 80-minute bars, with volume]
What does Elliott wave theory say? Here are the waves that underly the analyses.
Principal Analysis:
- Rising wave 5{0} is underway. It is a wave of Intermediate degree that began in December 2018.
- It is in its final subwave, wave 5{-1}.
- Within wave 5{-1}, rising waves 3{-2}, 3{-3} and 3{-4} are underway, as is wave 5{-5}.
- Wave 5{-6} is underway and is in its final subwave, uptrending wave 5{-7}, which in turn is in its final subwave, uptrending wave 5{-8}.
- Wave 5{-8} is in its initial subwave, wave 1{-9}. [Update for afternoon analysis.]
Reading the chart. Price movements — waves – – in Elliott wave analysis are labeled with numbers within trending waves and letters with corrective waves. The subscripts — numbers in curly brackets — designate the wave’s degree, which, in Elliott wave analysis, means the relative position of a wave within the larger and smaller structures that make up the chart. R.N. Elliott, who in the 1930s developed the form of analysis that bears his name, viewed the chart as a complex structure of smaller waves nested within larger waves, which in turn are nested within still larger waves. In mathematics it’s called a fractal structure, where at every scale the pattern is similar to the others.
Learning and other resources. Elliott wave analysis provides context, not prophecy. As the 20th century semanticist Alfred Korzybski put it in his book Science and Sanity (1933), “The map is not the territory … The only usefulness of a map depends on similarity of structure between the empirical world and the map.” And I would add, in the ever-changing markets, we can judge that similarity of structure only after the fact.
See the menu page Analytical Methods for a rundown on where to go for information on Elliott wave analysis.
By Tim Bovee, Portland, Oregon, July 5, 2024
Disclaimer
Tim Bovee, Private Trader tracks the analysis and trades of a private trader for his own accounts. Nothing in this blog constitutes a recommendation to buy or sell stocks, options or any other financial instrument. The only purpose of this blog is to provide education and entertainment.
No trader is ever 100 percent successful in his or her trades. Trading in the stock and option markets is risky and uncertain. Each trader must make trading decisions for his or her own account, and take responsibility for the consequences.
License
All content on Tim Bovee, Private Trader by Timothy K. Bovee is licensed under a Creative Commons Attribution-ShareAlike 4.0 International License.
Based on a work at www.timbovee.com.


You must be logged in to post a comment.