3:30 p.m. New York time
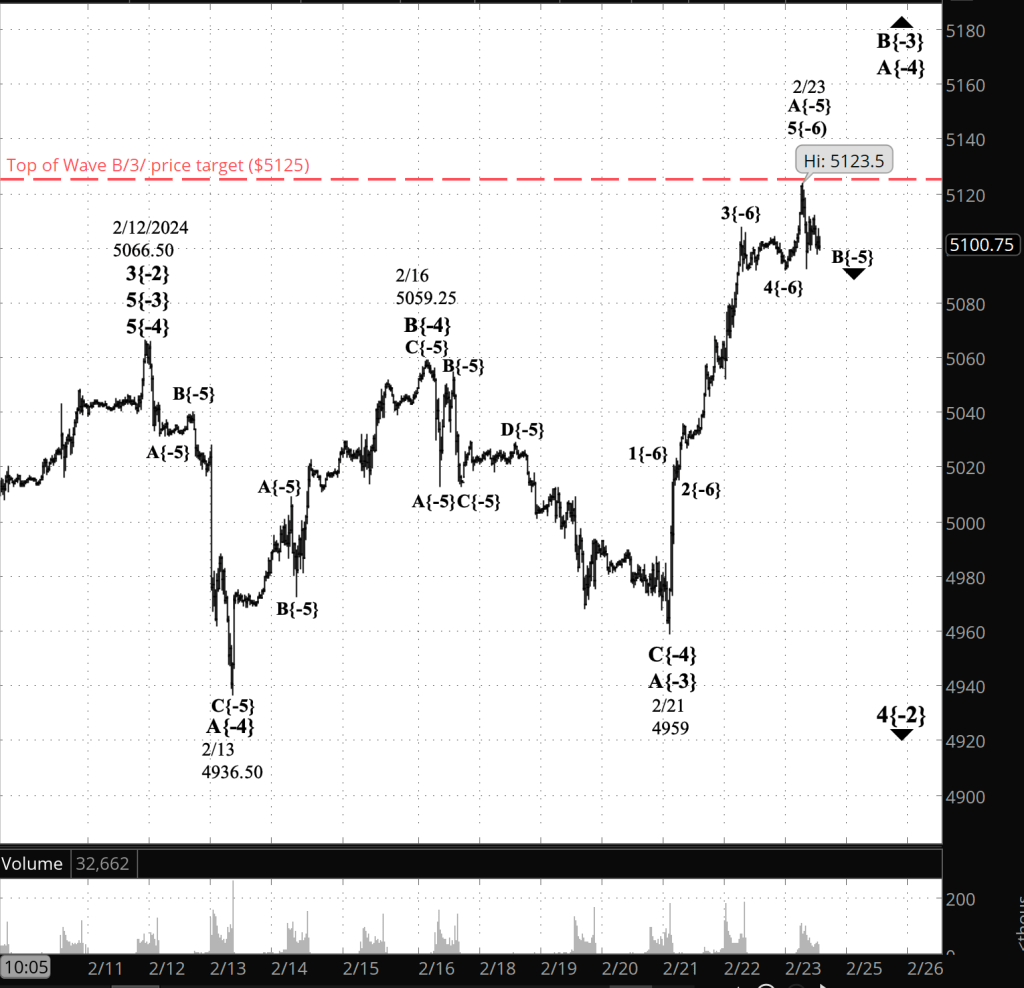
Half an hour before the closing bell. The S&P 500 futures rose to 5105.50 during the session and then retreated into the 5070s. The price remained above the end point of the low-degree B wave, B{-5} on the chart, that was the center of this morning’s discussion.
That the price has remained above that level, 5060, increases the likelihood that this morning’s principal analysis is a correct reading of the Chart: Wave C{-5} within wave A{-4} within wave B{-3} are underway, all within wave 4{-2} downward correction that began on February 12. If the price were to fall below 5060, then the alternative analysis would return to the chart, showing wave B{-5} as still underway.
I’ve updated the chart.
2:10 p.m. New York time
Another Trade. I’ve entered a short iron Fly position on XLE, one day prior to expiration, and have added an analysis of the trade to today’s trading post.
1:30 p.m. New York time
Trade. I’ve entered a short Iron Fly position on SPY, one day before expiration, and have posted an analysis of the trade, in which I discuss a modification to my exit strategy.
9:35 a.m. New York time
What’s happening now? The S&P 500 E-mini futures rose sharply upon the release of the Personal Consumption Expenditure (PCE) price index, reaching above 5100 at the opening bell.
What does it mean? In Elliott Wave Theory, the overnight low, 5060, was the end of a low-degree declining B wave and the start of a rising C wave.
Those small waves are subwaves, three degrees lower, of a 4th-wave downward correction that began on February 12. That 4th wave is working through its rising middle wave, a larger B wave, which in turn is in its rising initial wave, a still larger A wave.
In the labelling on the chart, the smallest wave discussed above, the rising C wave, is wave C{-5}, the subscript in curly brackets being the degree designator, showing the degree’s location relative to an expanding Diagonal Triangle, wave 5{0}, that began in December 2018. See the “Reading the chart” section, below, for more about degrees.
Wave C{-5} is a subwave of wave A{-4}, which in turn is a subwve of wave B{-3}, which in turn is subwave of the downward correction, wave 4{-2}.
Wave C{-5}, when complete, will also be the end of rising wave A{-4}, which will be followed by a declining corrective wave, B{-4}.
What are the alternatives? Whipsaws happen. It’s quite possible that what I’ve labeled as a rising C wave is a subwave of the declining B wave, which is still. On the chart, that would mean that wave B{-5} is still underway and wave C{-5} has not yet begun.
Also, what I’m labelling as degree {-4} could instead be degree {-3}, one degree larger, pushing everything up one in the fractal hierarchy.
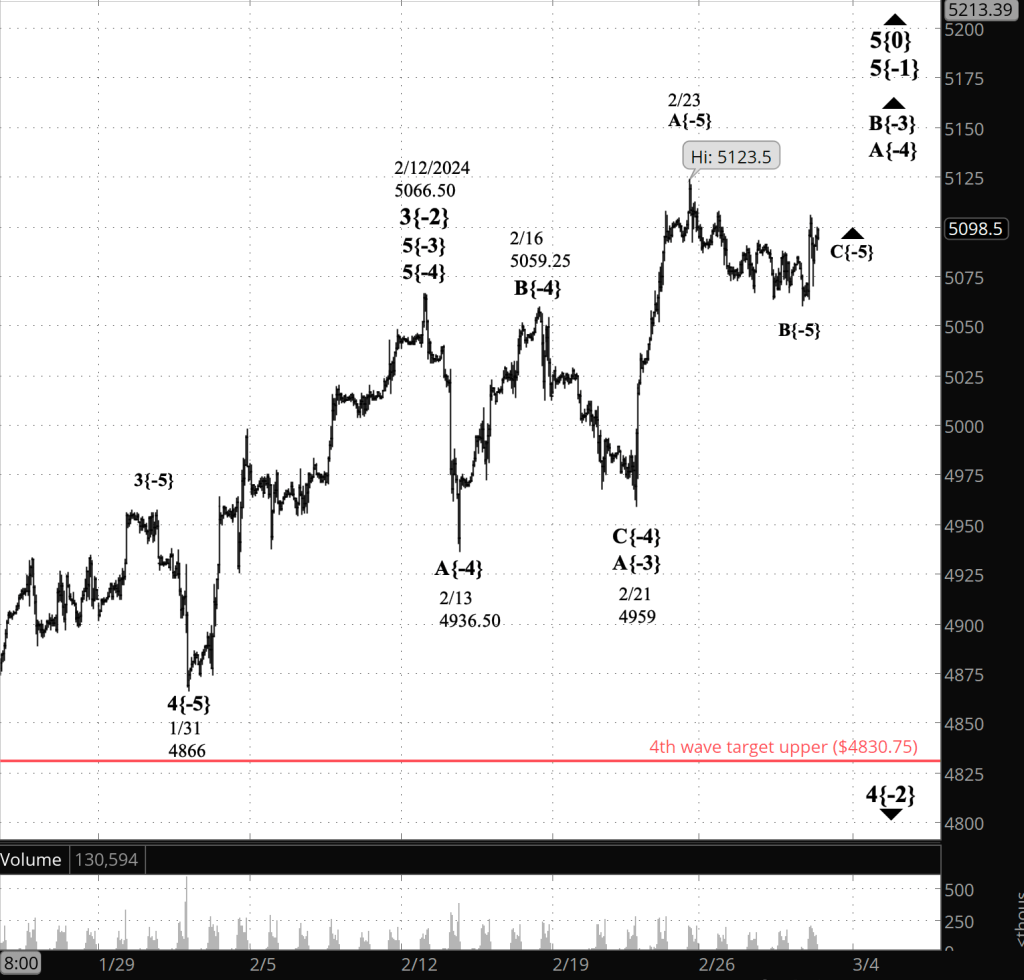
[S&P 500 E-mini futures at 3:30 p.m., 1-hour bars, with volume]
What does Elliott wave theory say? Here are the waves that underly the analyses.
Principal Analysis:
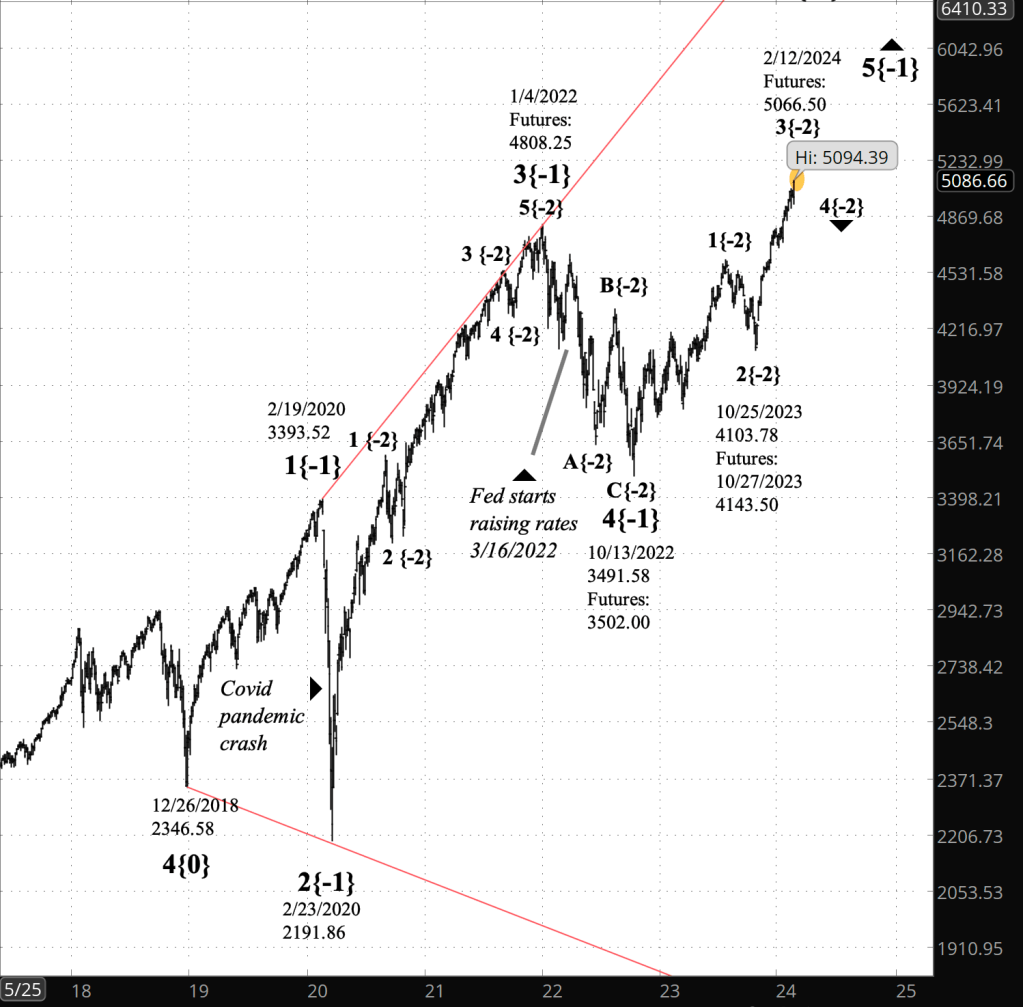
- Wave 5{0}, an expanding Diagonal Triangle, began on December 26, 2018.
- Within it, an uptrend, wave 5{-1}, began on October 13, 2022 and is underway.
- Wave 5{-1} is the parent wave of a downward correction, wave 4{-2}, that began on February 12, 2024.
- Wave 4{-2} is in its second subwave, wave B{-3}, which in turn is in wave A{-4}, its initial subwave.
- Wave A{-4} is in its final subwave, wave C{-5}.
We Are Here.
These are the waves currently in progress under my principal analysis. Each line on the list shows the wave number, with the subscript in curly brackets, the traditional degree name, the starting date, the starting price of the S&P 500 E-mini futures, and the direction of the wave.
- S&P 500 Index:
- 5{+3} Supercycle, 7/8/1932, 4.40 (up)
- 5{+2} Cycle, 12/9/1974, 60.96 (up)
- 5{+1} Primary, 3/6/2009, 666.79 (up)
- 5{0} Intermediate, 12/26/2018, 2346.58 (up)
- S&P 500 Futures and index:
- 5{-1} Minor, 10/13/2022, 3502 (up) (futures), 3491.58 (up) (index)
- S&P 500 Futures:
- 4{-2} Minute, 2/12/2024, 5066.50 (down)
- B{-3} Minuette, 2/21/2024, 4959 (up)
Reading the chart. Price movements — waves – – in Elliott wave analysis are labeled with numbers within trending waves and letters with corrective waves. The subscripts — numbers in curly brackets — designate the wave’s degree, which, in Elliott wave analysis, means the relative position of a wave within the larger and smaller structures that make up the chart. R.N. Elliott, who in the 1930s developed the form of analysis that bears his name, viewed the chart as a complex structure of smaller waves nested within larger waves, which in turn are nested within still larger waves. In mathematics it’s called a fractal structure, where at every scale the pattern is similar to the others.
Learning and other resources. Elliott wave analysis provides context, not prophecy. As the 20th century semanticist Alfred Korzybski put it in his book Science and Sanity (1933), “The map is not the territory … The only usefulness of a map depends on similarity of structure between the empirical world and the map.” And I would add, in the ever-changing markets, we can judge that similarity of structure only after the fact.
See the menu page Analytical Methods for a rundown on where to go for information on Elliott wave analysis.
By Tim Bovee, Portland, Oregon, February 29, 2024
Disclaimer
Tim Bovee, Private Trader tracks the analysis and trades of a private trader for his own accounts. Nothing in this blog constitutes a recommendation to buy or sell stocks, options or any other financial instrument. The only purpose of this blog is to provide education and entertainment.
No trader is ever 100 percent successful in his or her trades. Trading in the stock and option markets is risky and uncertain. Each trader must make trading decisions for his or her own account, and take responsibility for the consequences.
License
All content on Tim Bovee, Private Trader by Timothy K. Bovee is licensed under a Creative Commons Attribution-ShareAlike 4.0 International License.
Based on a work at www.timbovee.com.


You must be logged in to post a comment.